Grasshopper data trees
Introducing data trees
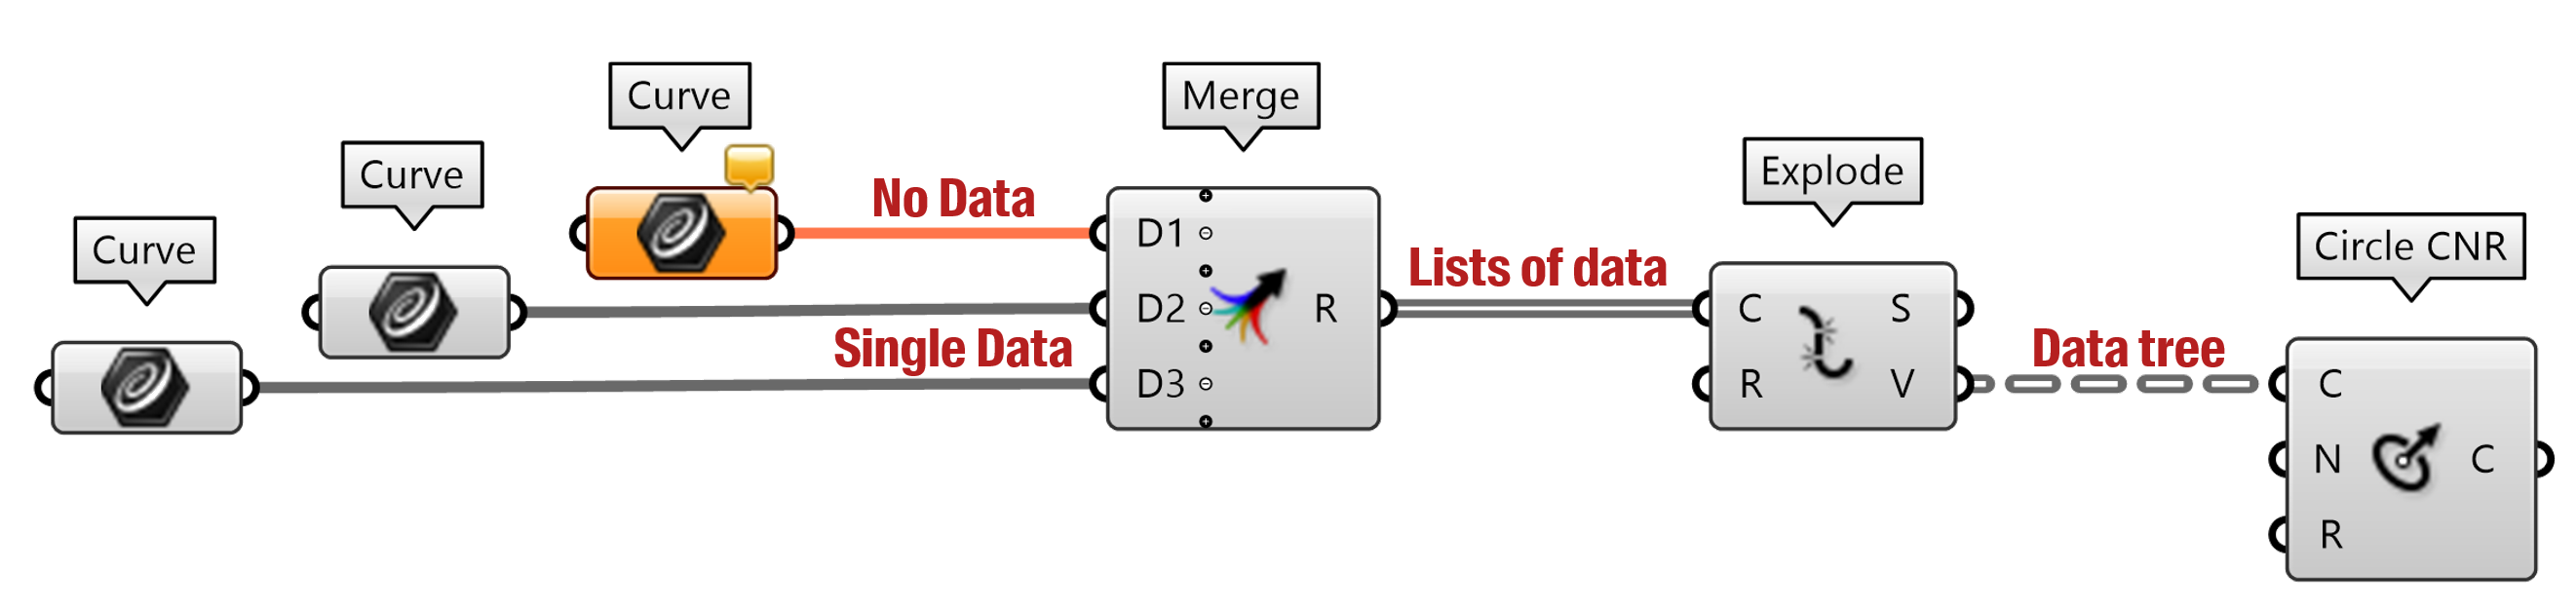
When connecting components on the Grasshopper canvas, you may already have noticed that all wires do not look the same. Indeed, different types of wires are used to indicate what is passing in the data flow. If there is no data, the wire is orange. If there is one element (e.g. one 3D point), the wire is a simple line. For a list of elements, the wire becomes a double-line. Lastly, dashed lines represent data trees which we will cover in that chapter.
Lists are convenient tools for storing large quantities of data. However, it’s a bit like having a big bag with a lot of stuff in it… Every time you want to take something in your bag you have to look for a long time before you find it! The whole idea of data trees is to be able to organize data in a structured way.
Below is an example provided by David Rutten (Grasshopper’s creator) to explain the purpose of data trees. Take three breps: a cube, a cylinder and a prism. Then, explode the faces of each brep, draw nine isocurves on each face, and divide each isocurve with nine points. If we were working with a list, all the points on the three breps would be together in the same list. This would make it very difficult to locate a point based on its index in the list.
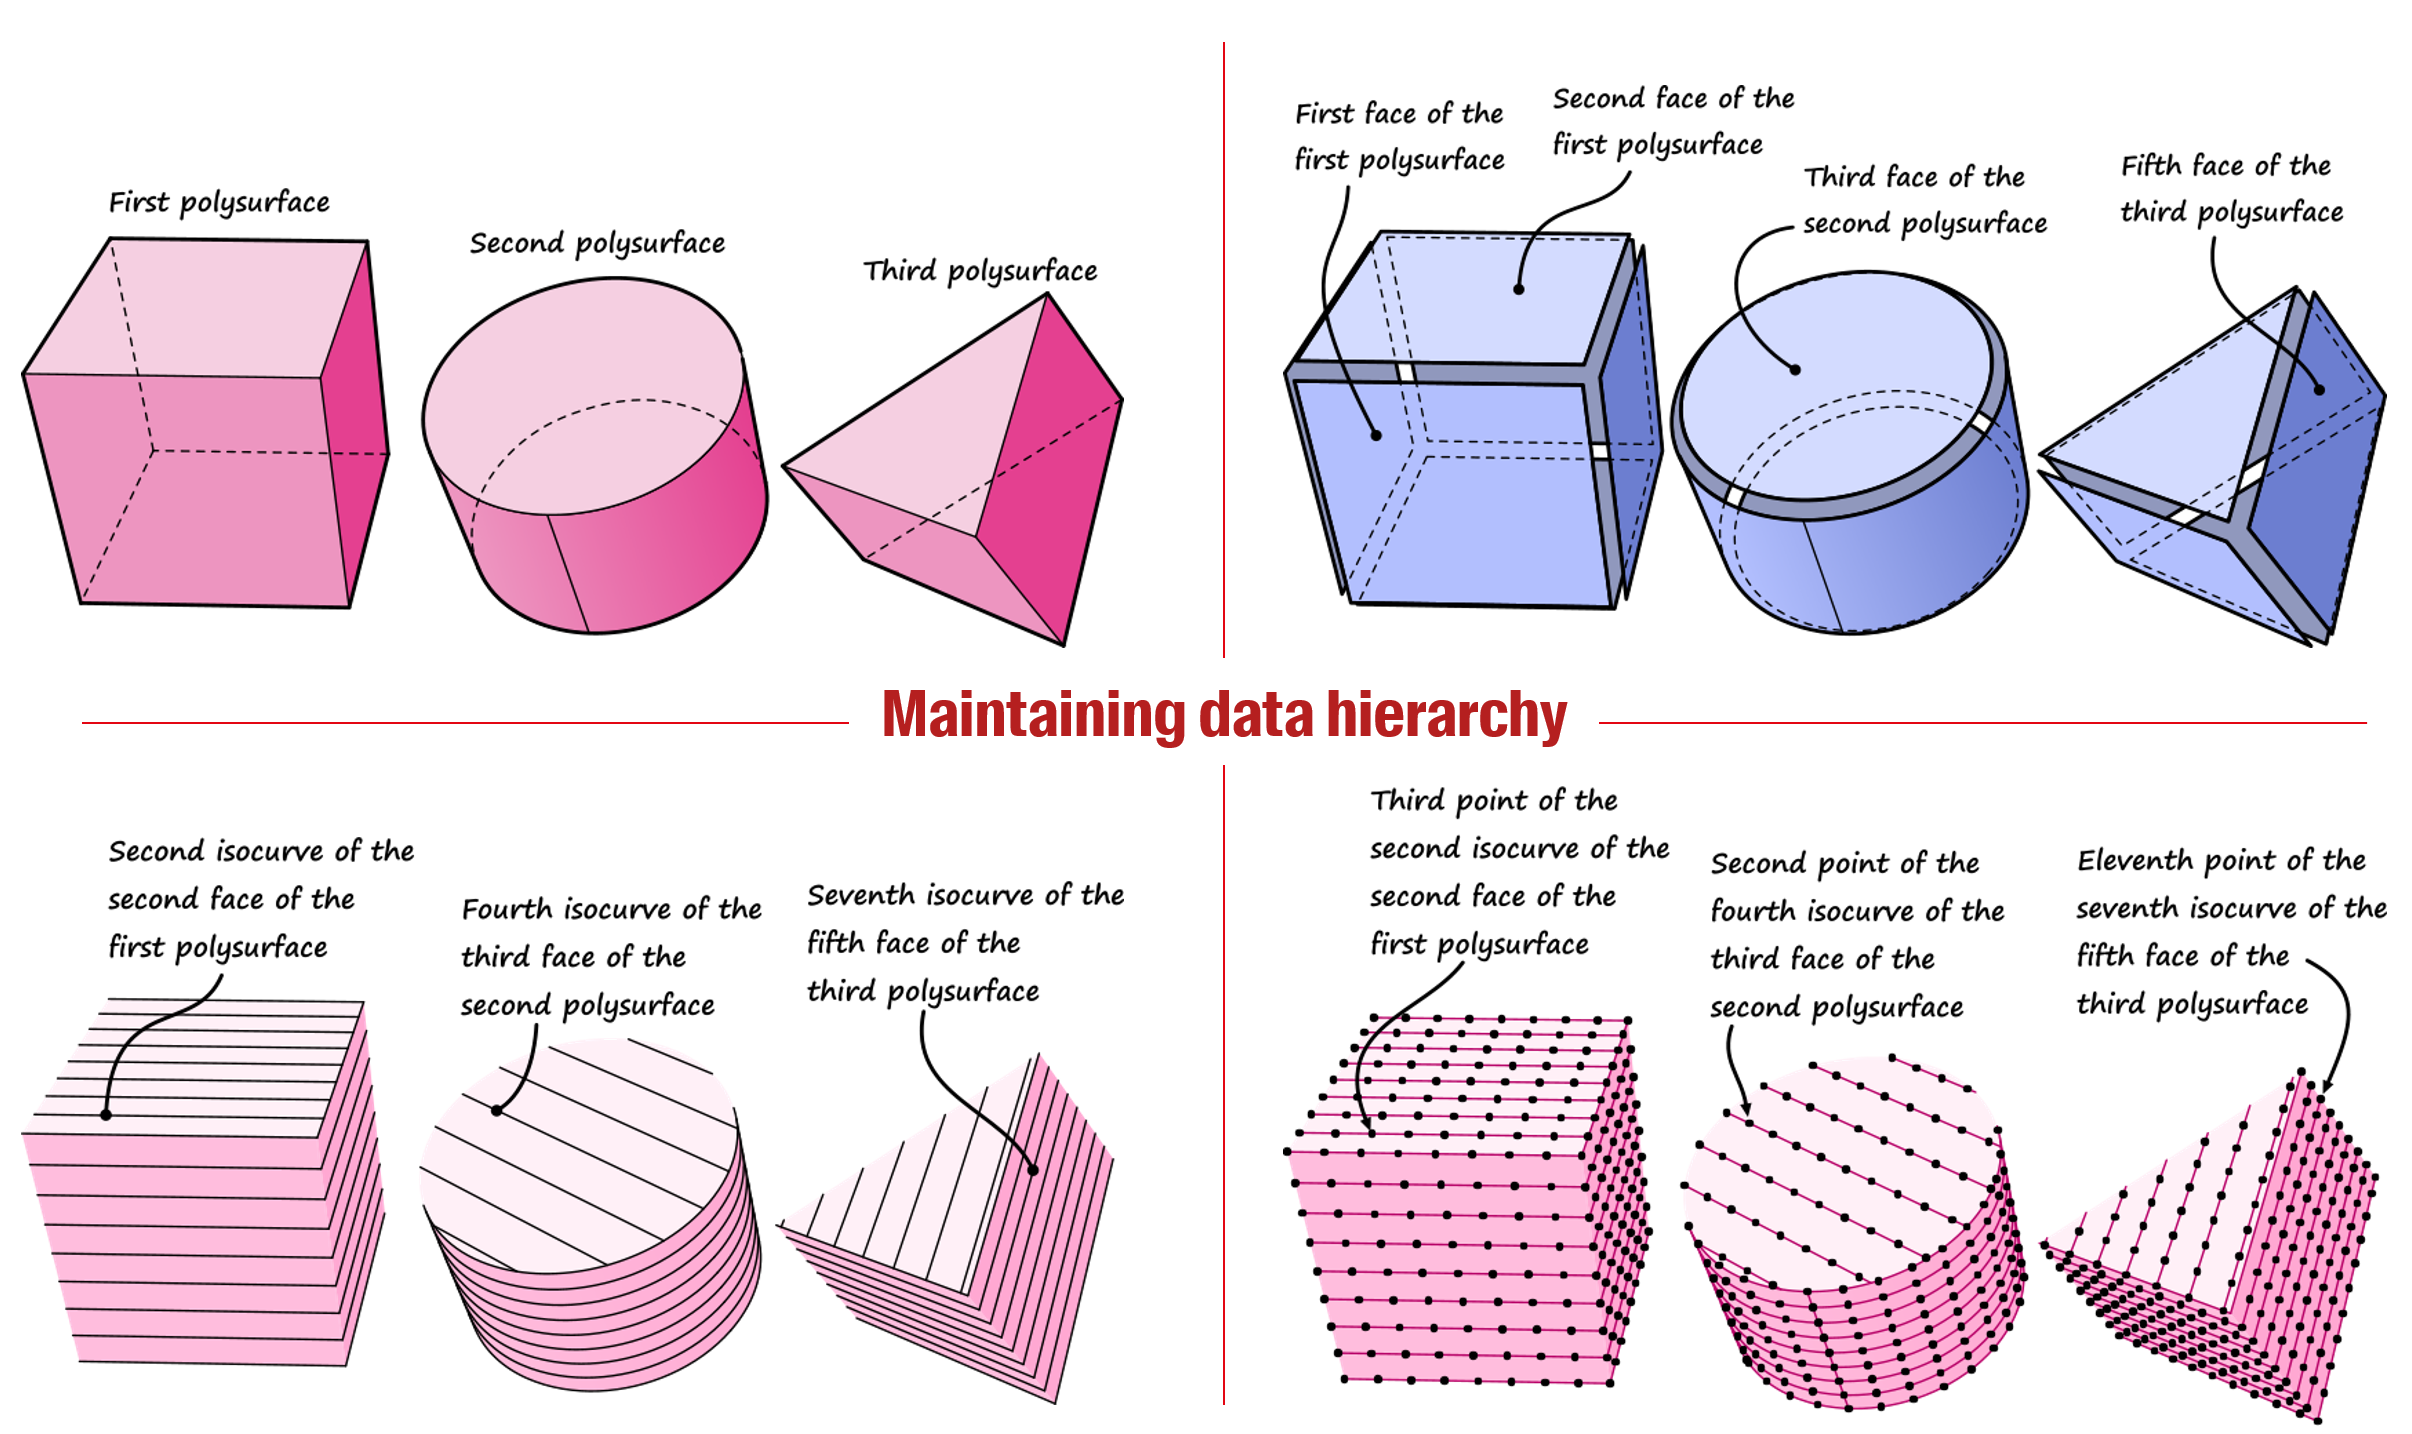
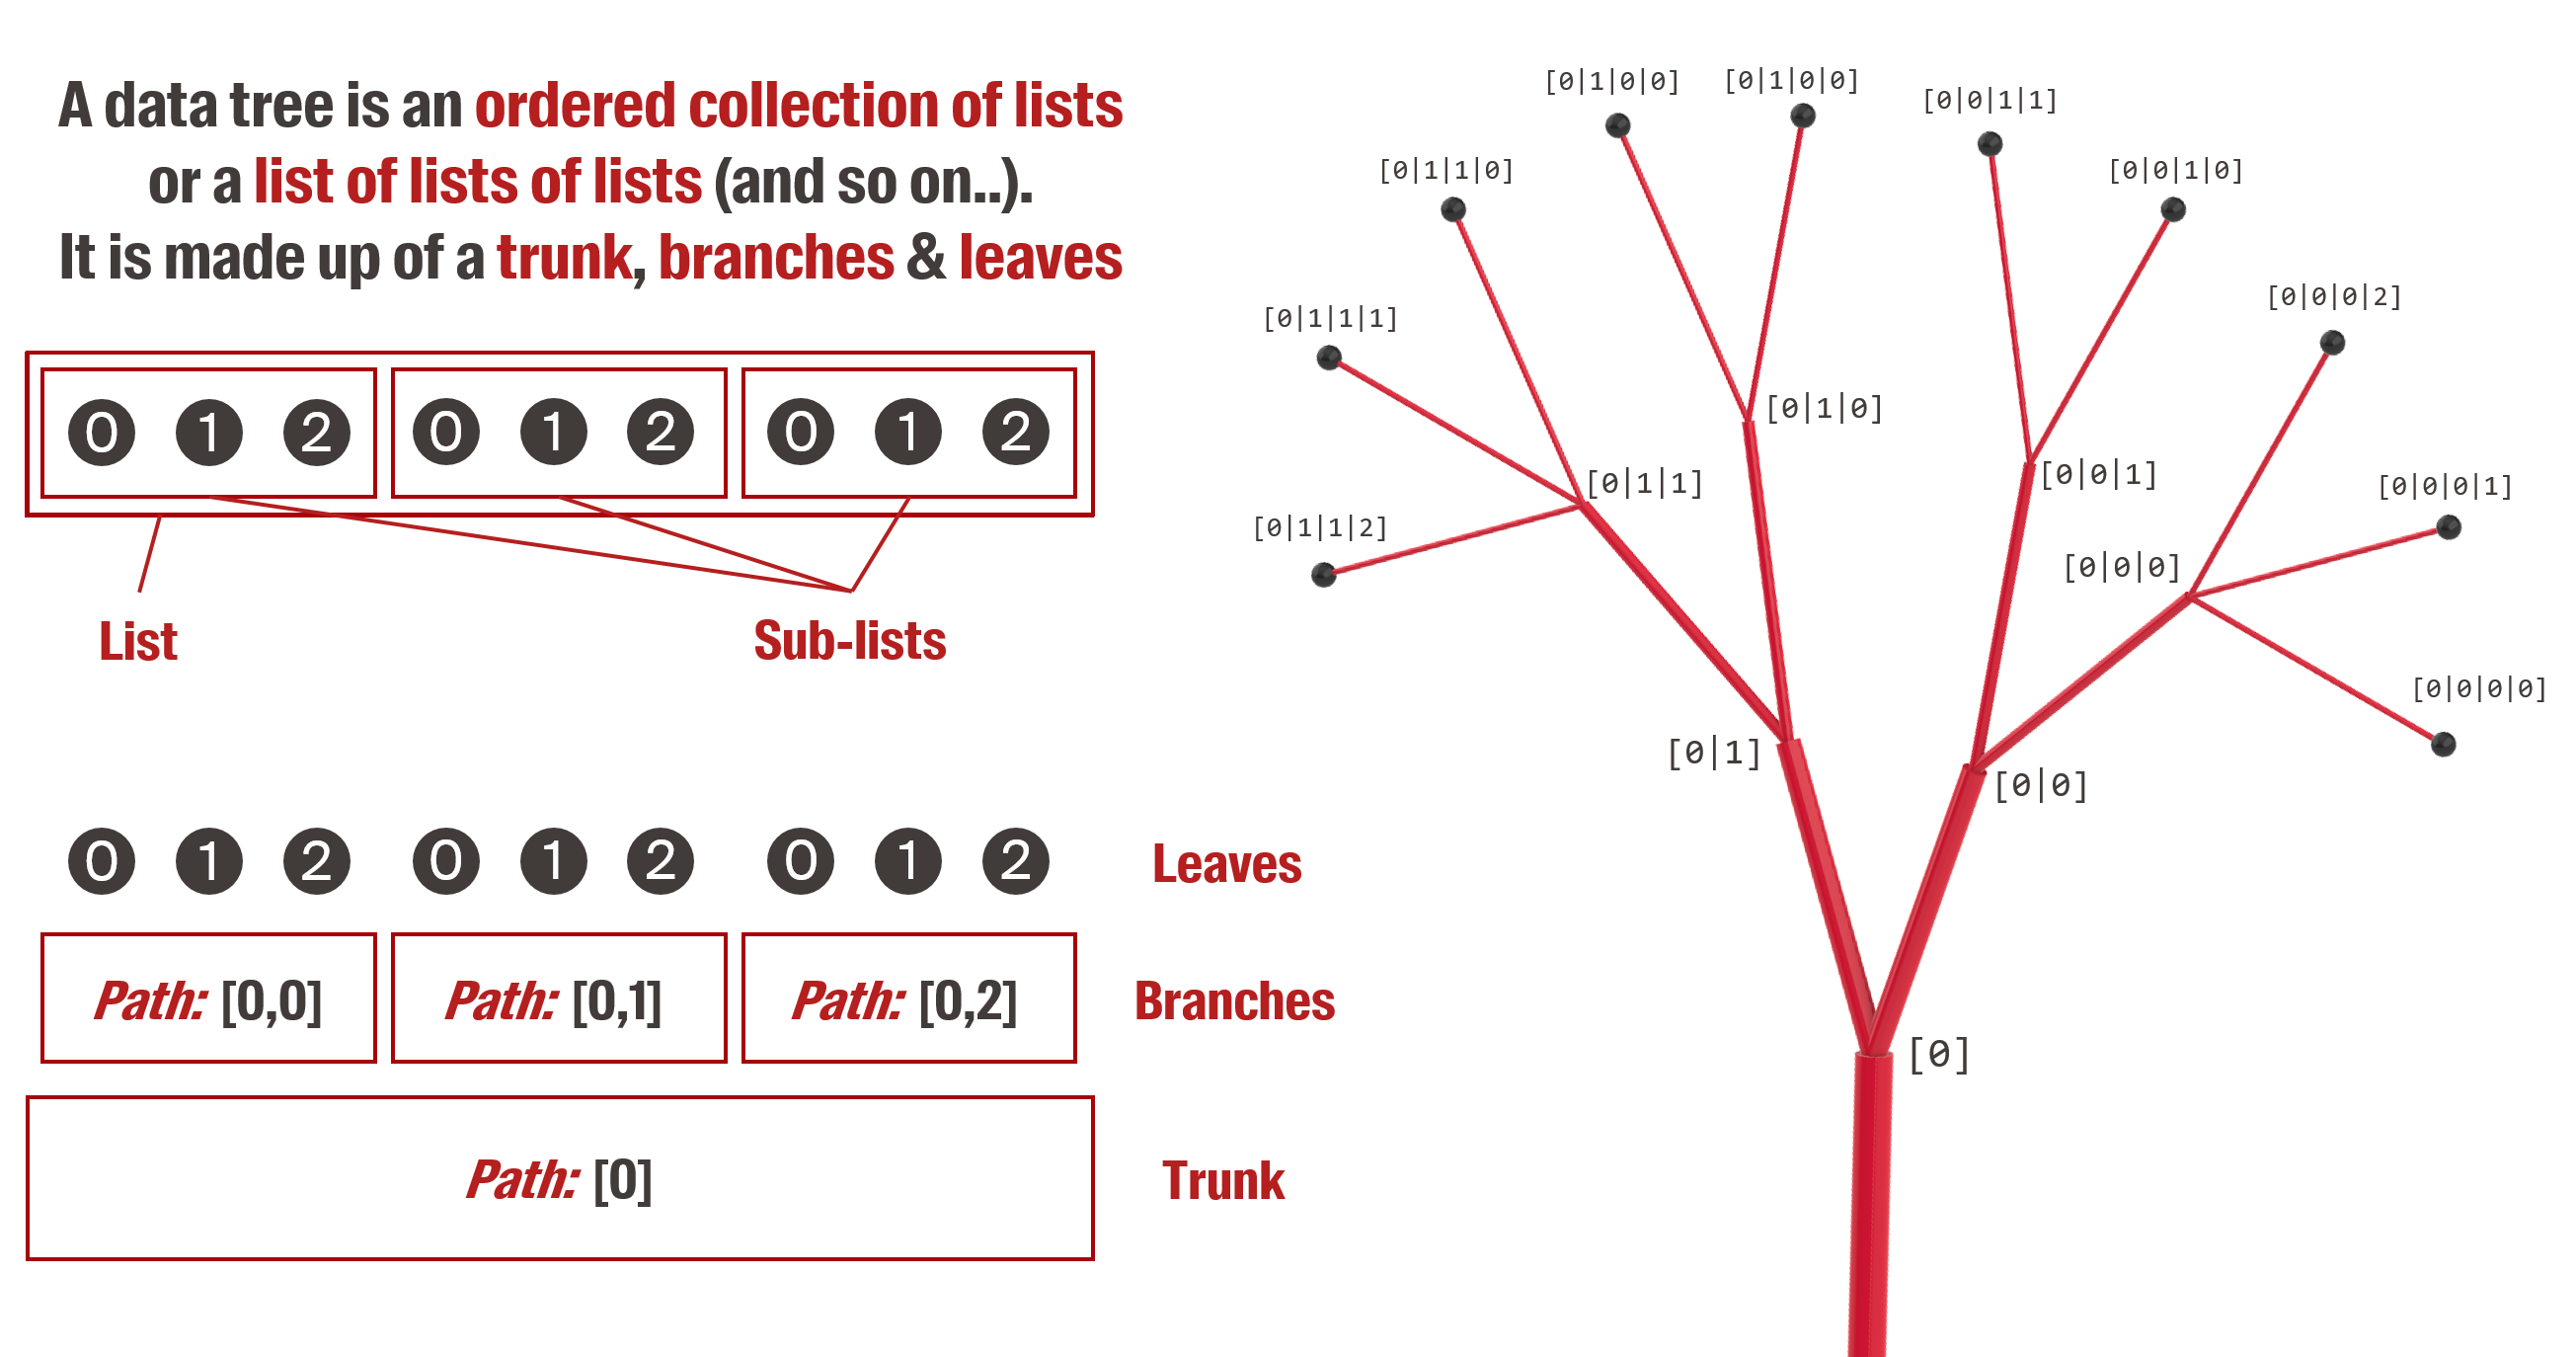
Data trees are lists of lists, or lists of lists of lists (etc.). Using this principle of nested lists allows to maintain the hierarchy of consecutive operations. In the example above, we could have stored the points in a list which itself would contain three lists (one for each solid) which would each contain nine lists (for each isocurve) which would each contain nine elements (the points).
So why do we call it a tree? Because we can represent this particular data structure as a tree graph where the main list is the trunk of the tree, the nested lists are the branches of the tree, and the elements are the leaves.
Besides, to easily access any leaf of the tree, we give a name to each branch called the path. The path of a branch is equivalent to the address of a house. If all the houses in a country were simply numbered from 1 to 1’000’000, it would be very complicated to orient oneself in this country and to locate a particular house. The postal code, the street and the number allow to structure the address by defining subsets of houses. Similarly, the path allows to identify a particular object in a tree by grouping similar objects in the same branch.
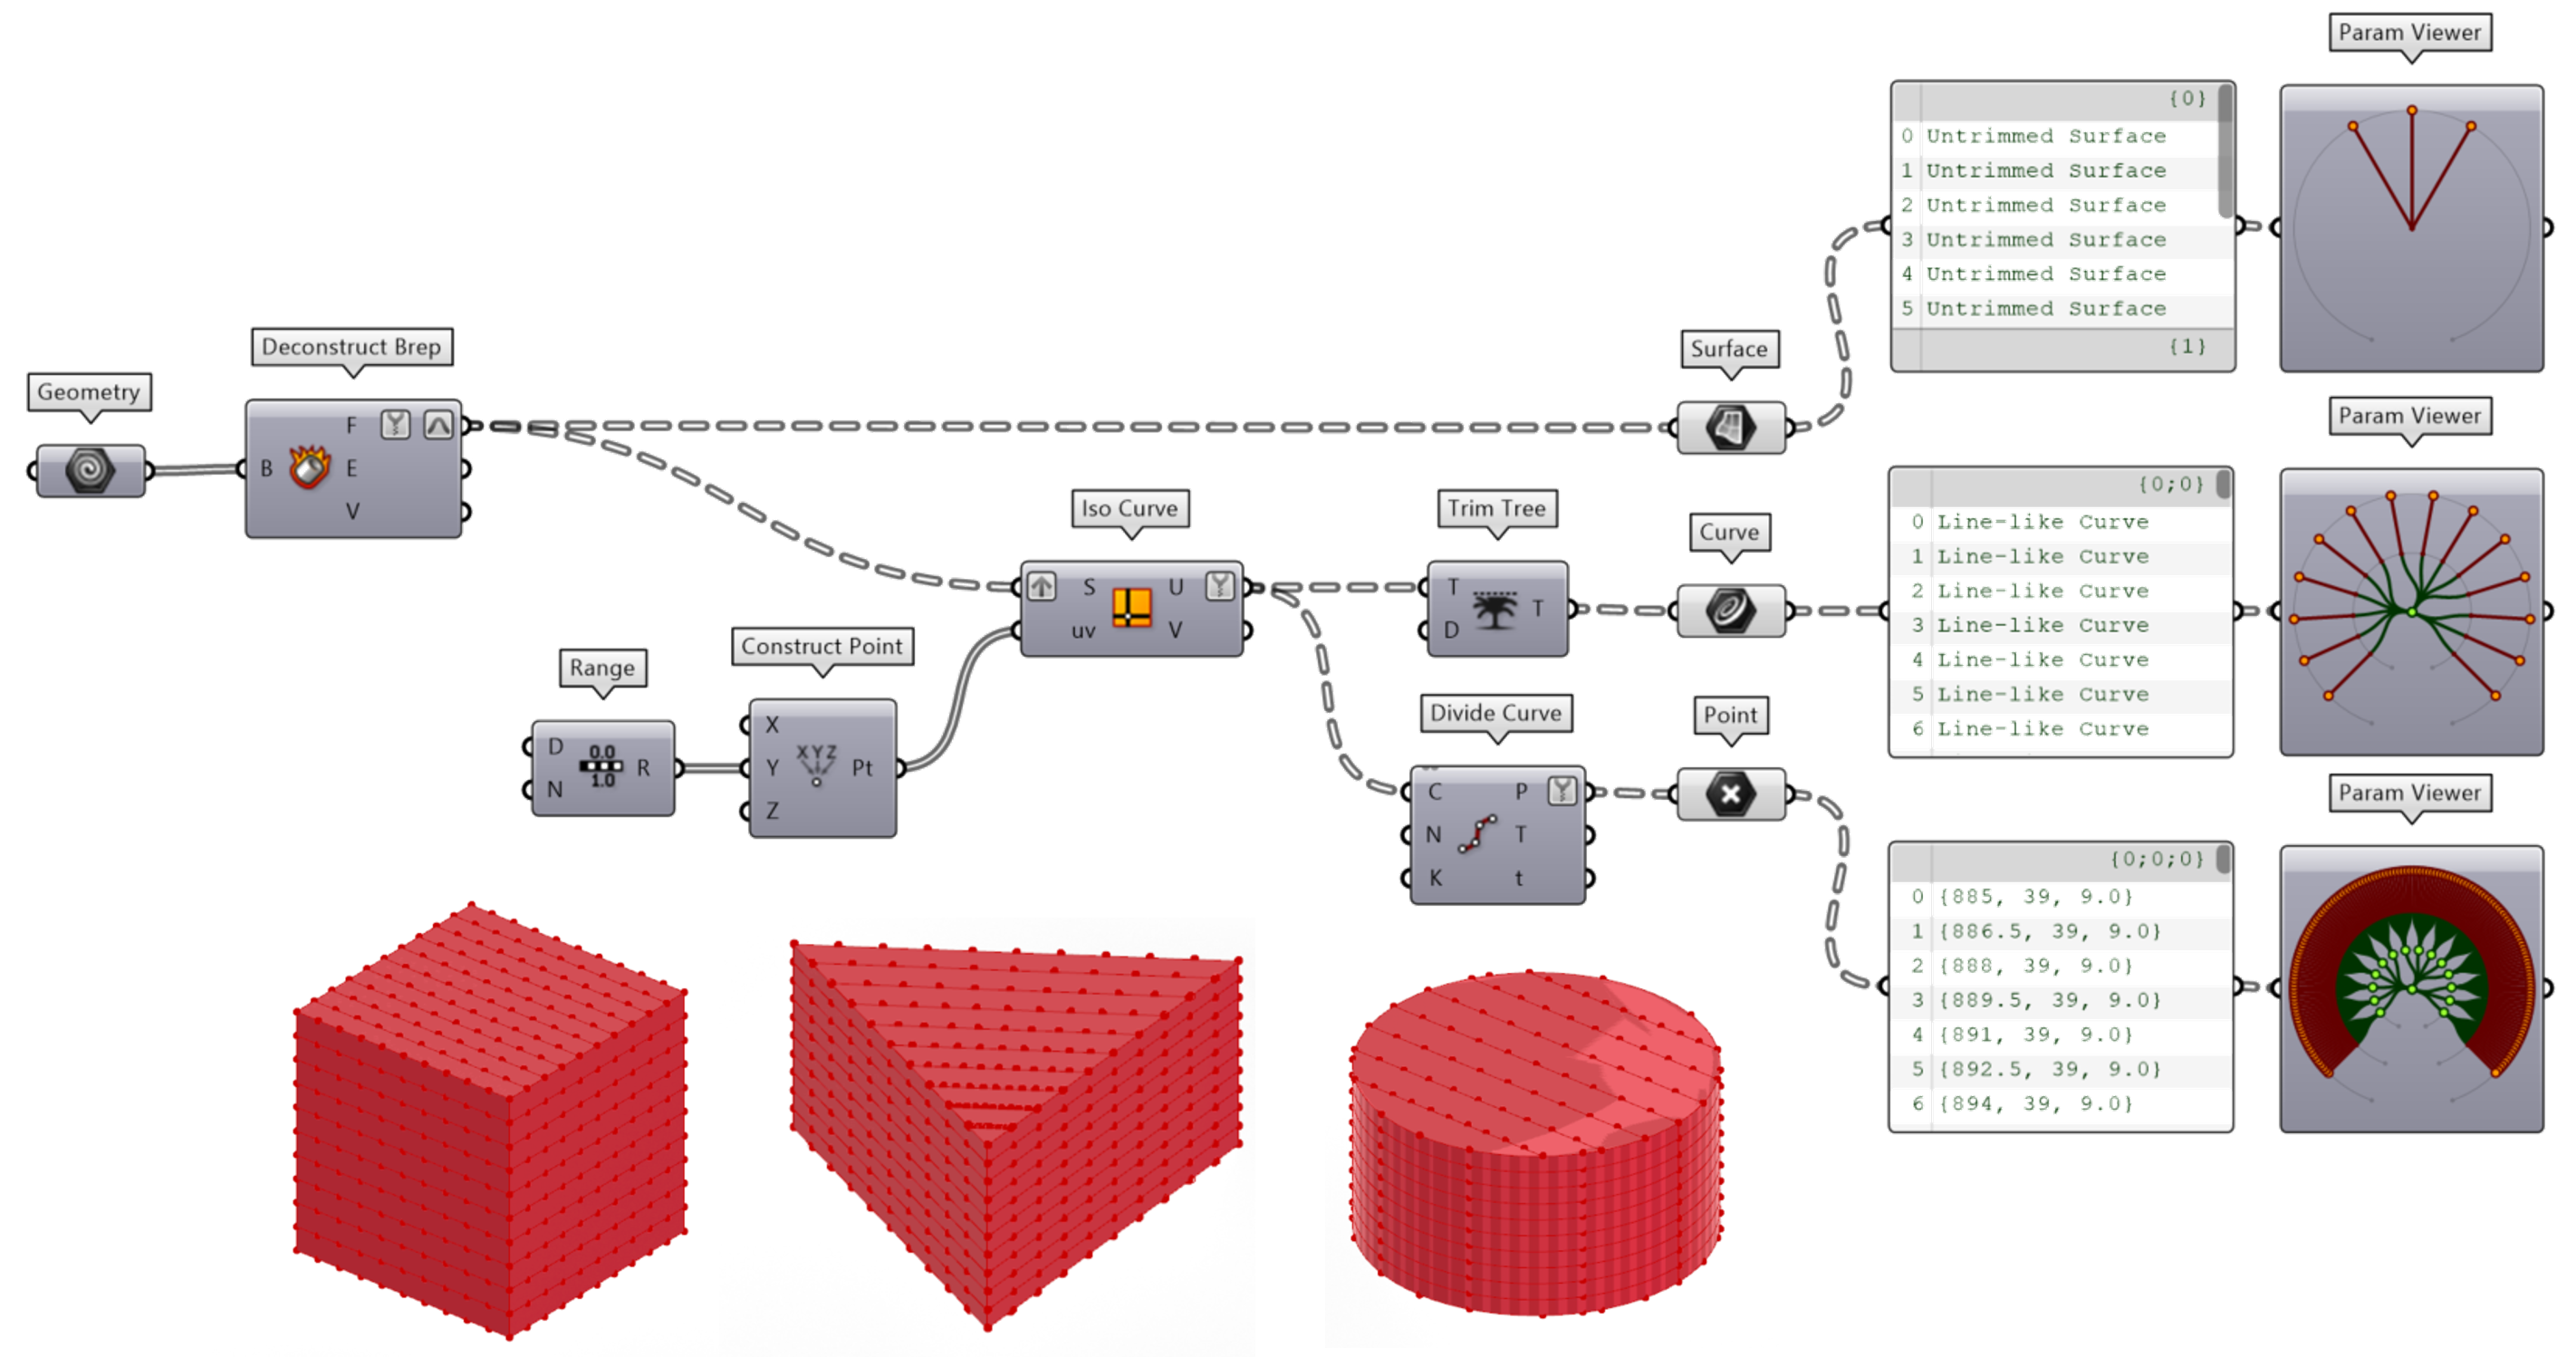
We can recreate David Rutten’s example in Grasshopper with the code below. The “Param viewer” component helps us to visualize the structure of the datatree. The “Tree statistics” component is also very useful to get information about the tree or specific branches.
Manipulating data trees
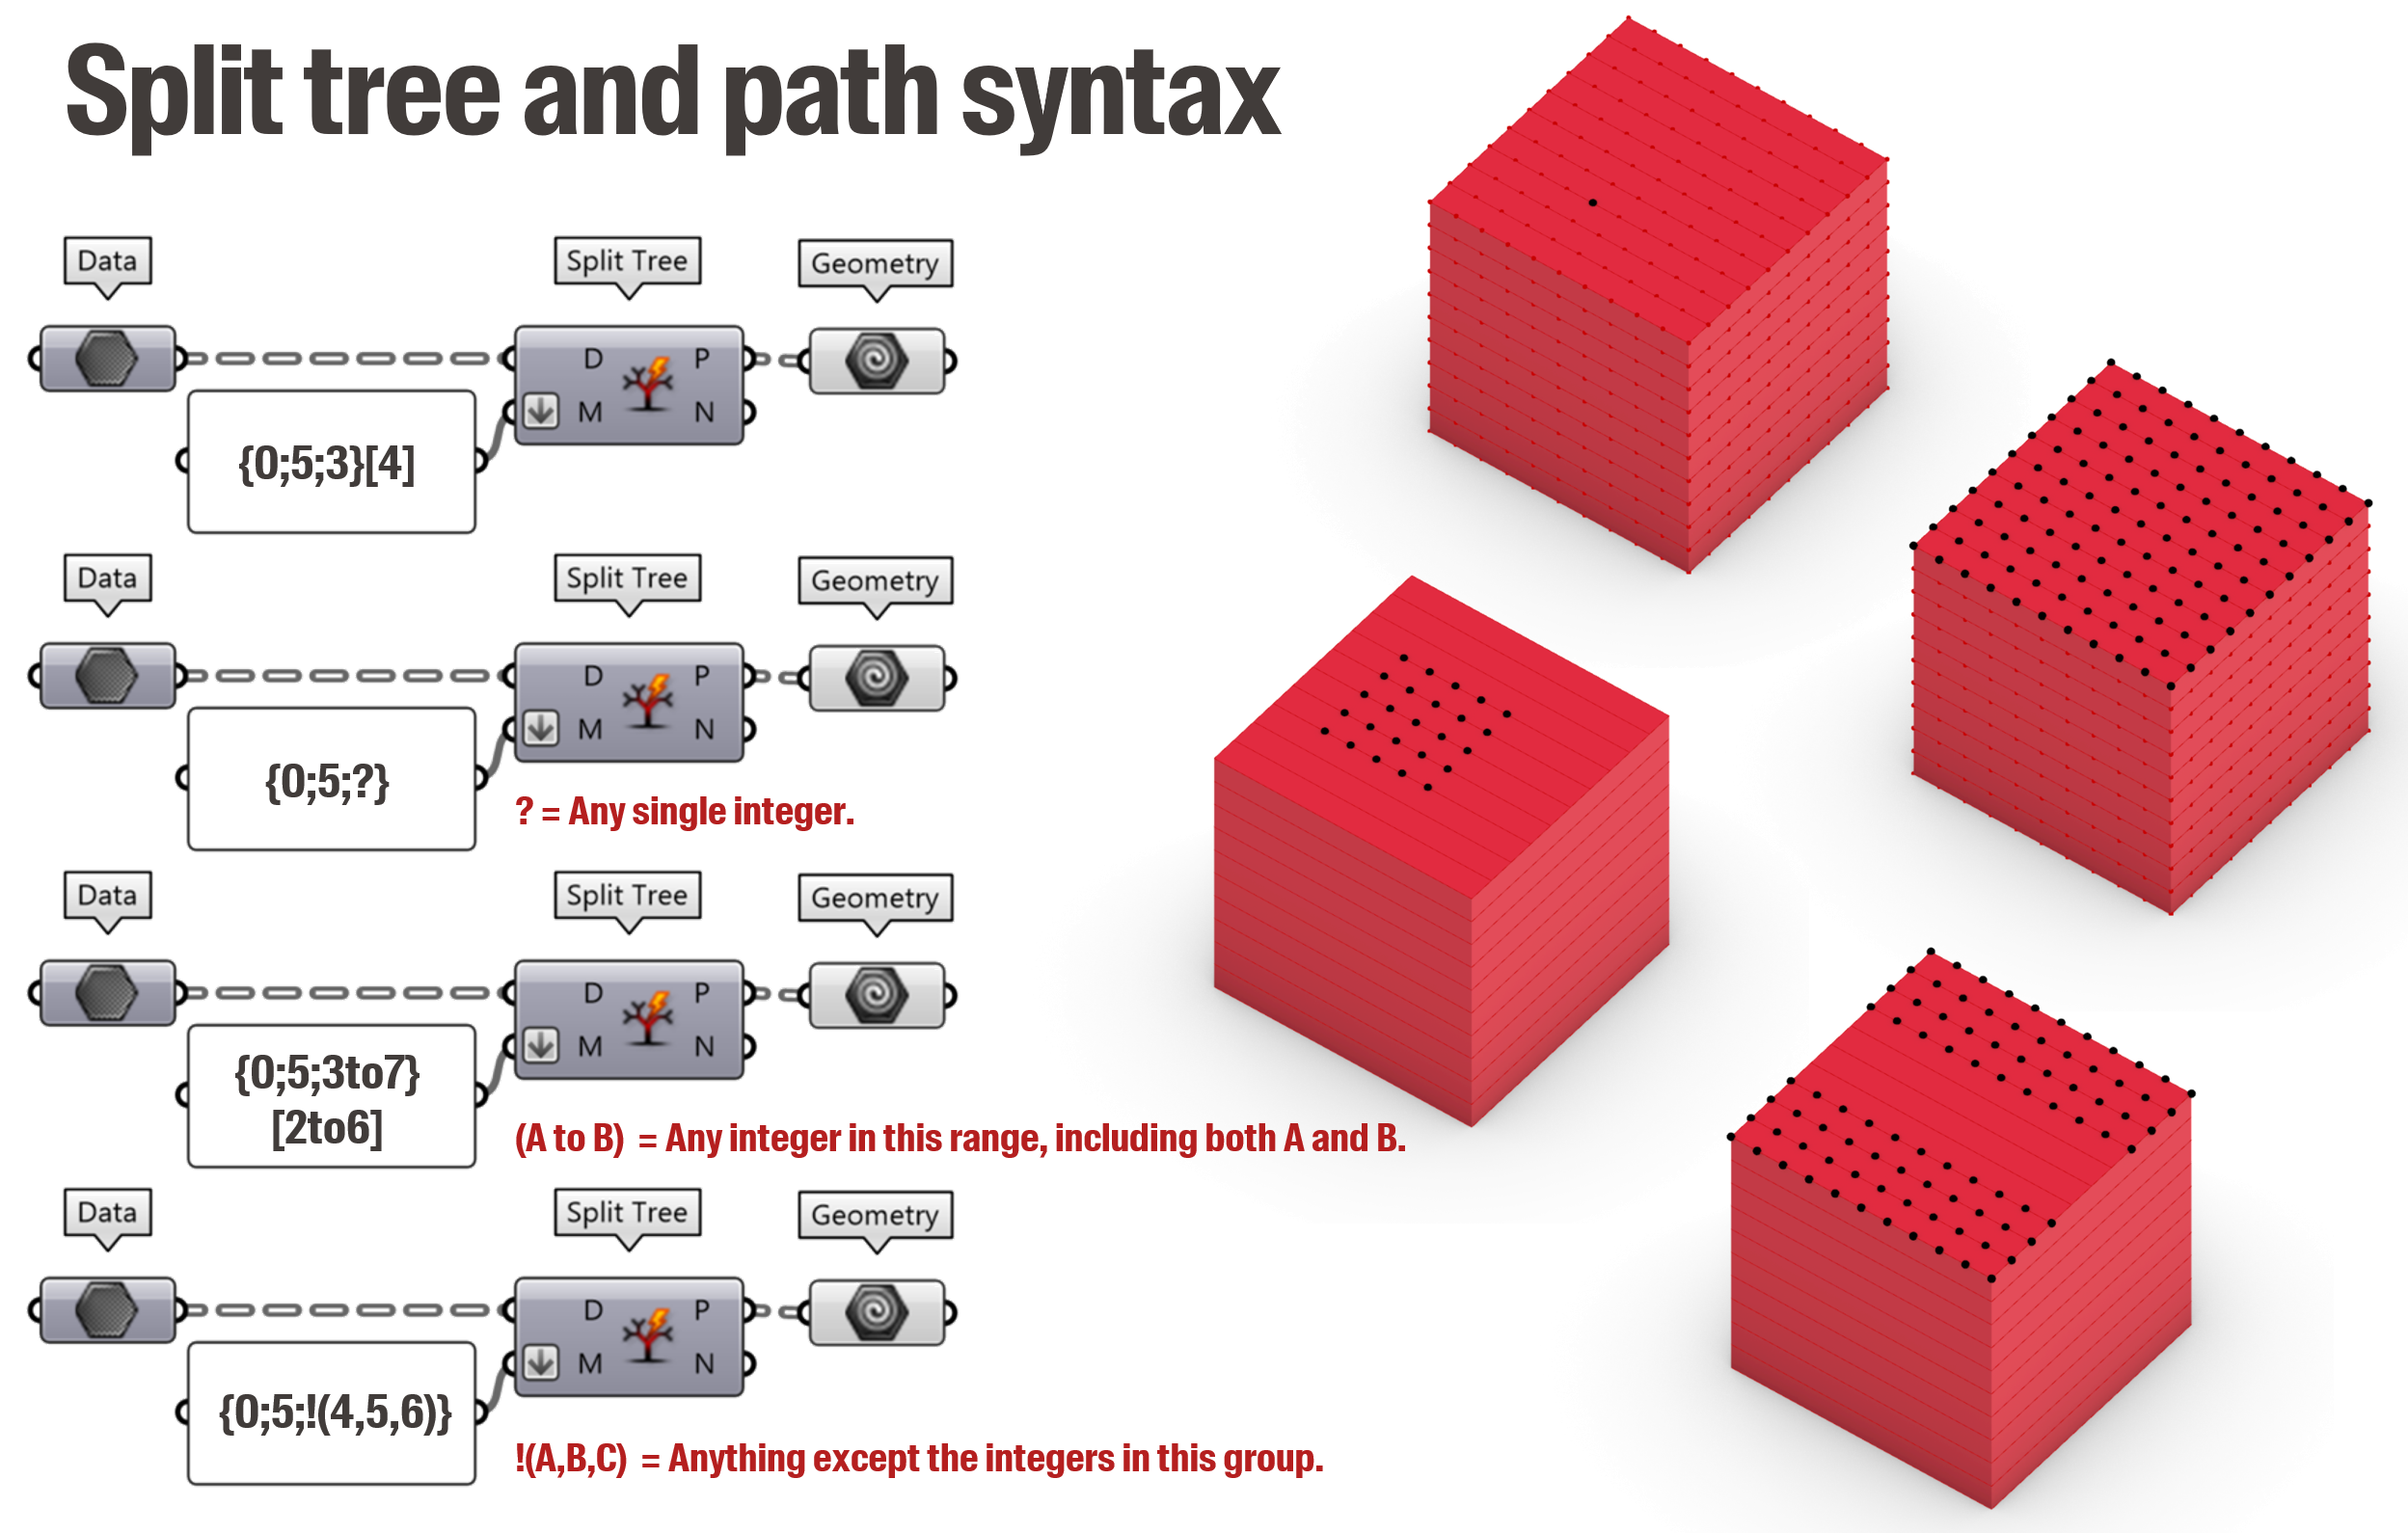
A powerful way to retrieve one or more specific items in a tree is to use the “Split Tree” component and give the path of the object as input. Paths obeys a strict syntax with the address of the branch written between curly brackets {} and the index of the element between square brackets []. You can also use some symbols such as ? or ! to select multiple elements at the same time as in the examples below. (Here is a detailed article about the path syntax).
In the same way that it is preferable to always pass lists of the same length as input to a component, it is also advisable to only pass trees with the same structure (same branch counts and paths). To do so, it is necessary to know three useful operations that allow to modify the structure of a tree: Graft, Flatten, and Simplify.
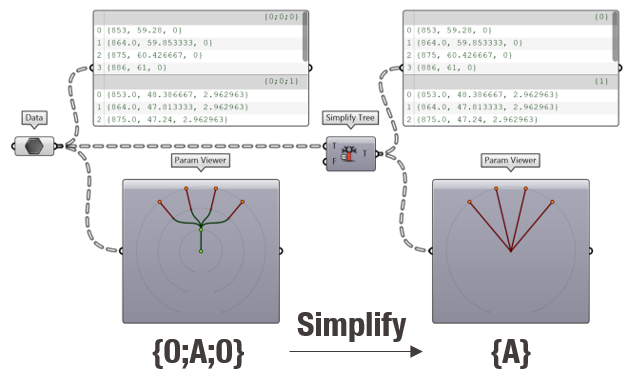
The “Simplify tree” component is useful to remove redundant branches in a tree. Often, Grasshopper will add a new branch after an operation which can lead to data trees with unnecessary long paths like {0, 0, 0, 0, 0}. In that case, “Simplify tree” will reduce the tree to one main branch {0}.
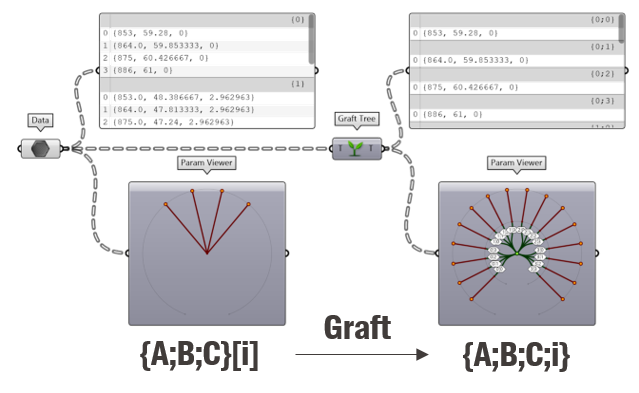
The “Graft tree” component is useful to convert a list to a data tree as it will create a new branch for each item in the list. For example, if you “graft” a list of ten elements, it will result in a tree with ten branches.
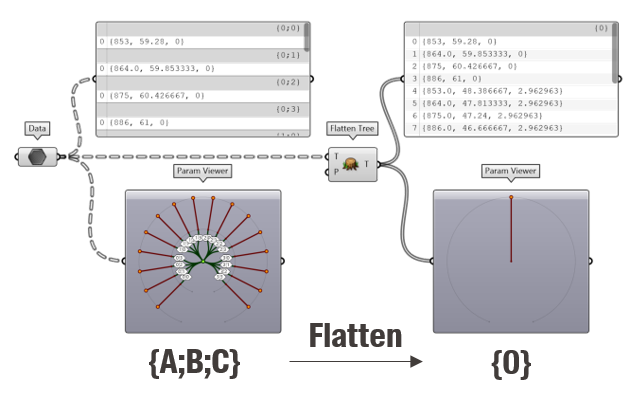
The “Flatten tree” component does the opposite. It will simply reduce the data tree to a single list.
Note that you can directly access those operations with a right-click on the input/output of any component. A small symbol (e.g. an upward arrow for “Graft”) will then appear next to this parameter to say that the data flow is being modified internally. While this shortcut method is more concise, it might also be more confusing than using a dedicated component for modifying the data trees. Like always, it is really up to you to find the good balance between being concise and being explicit…
Combining and exploding data trees
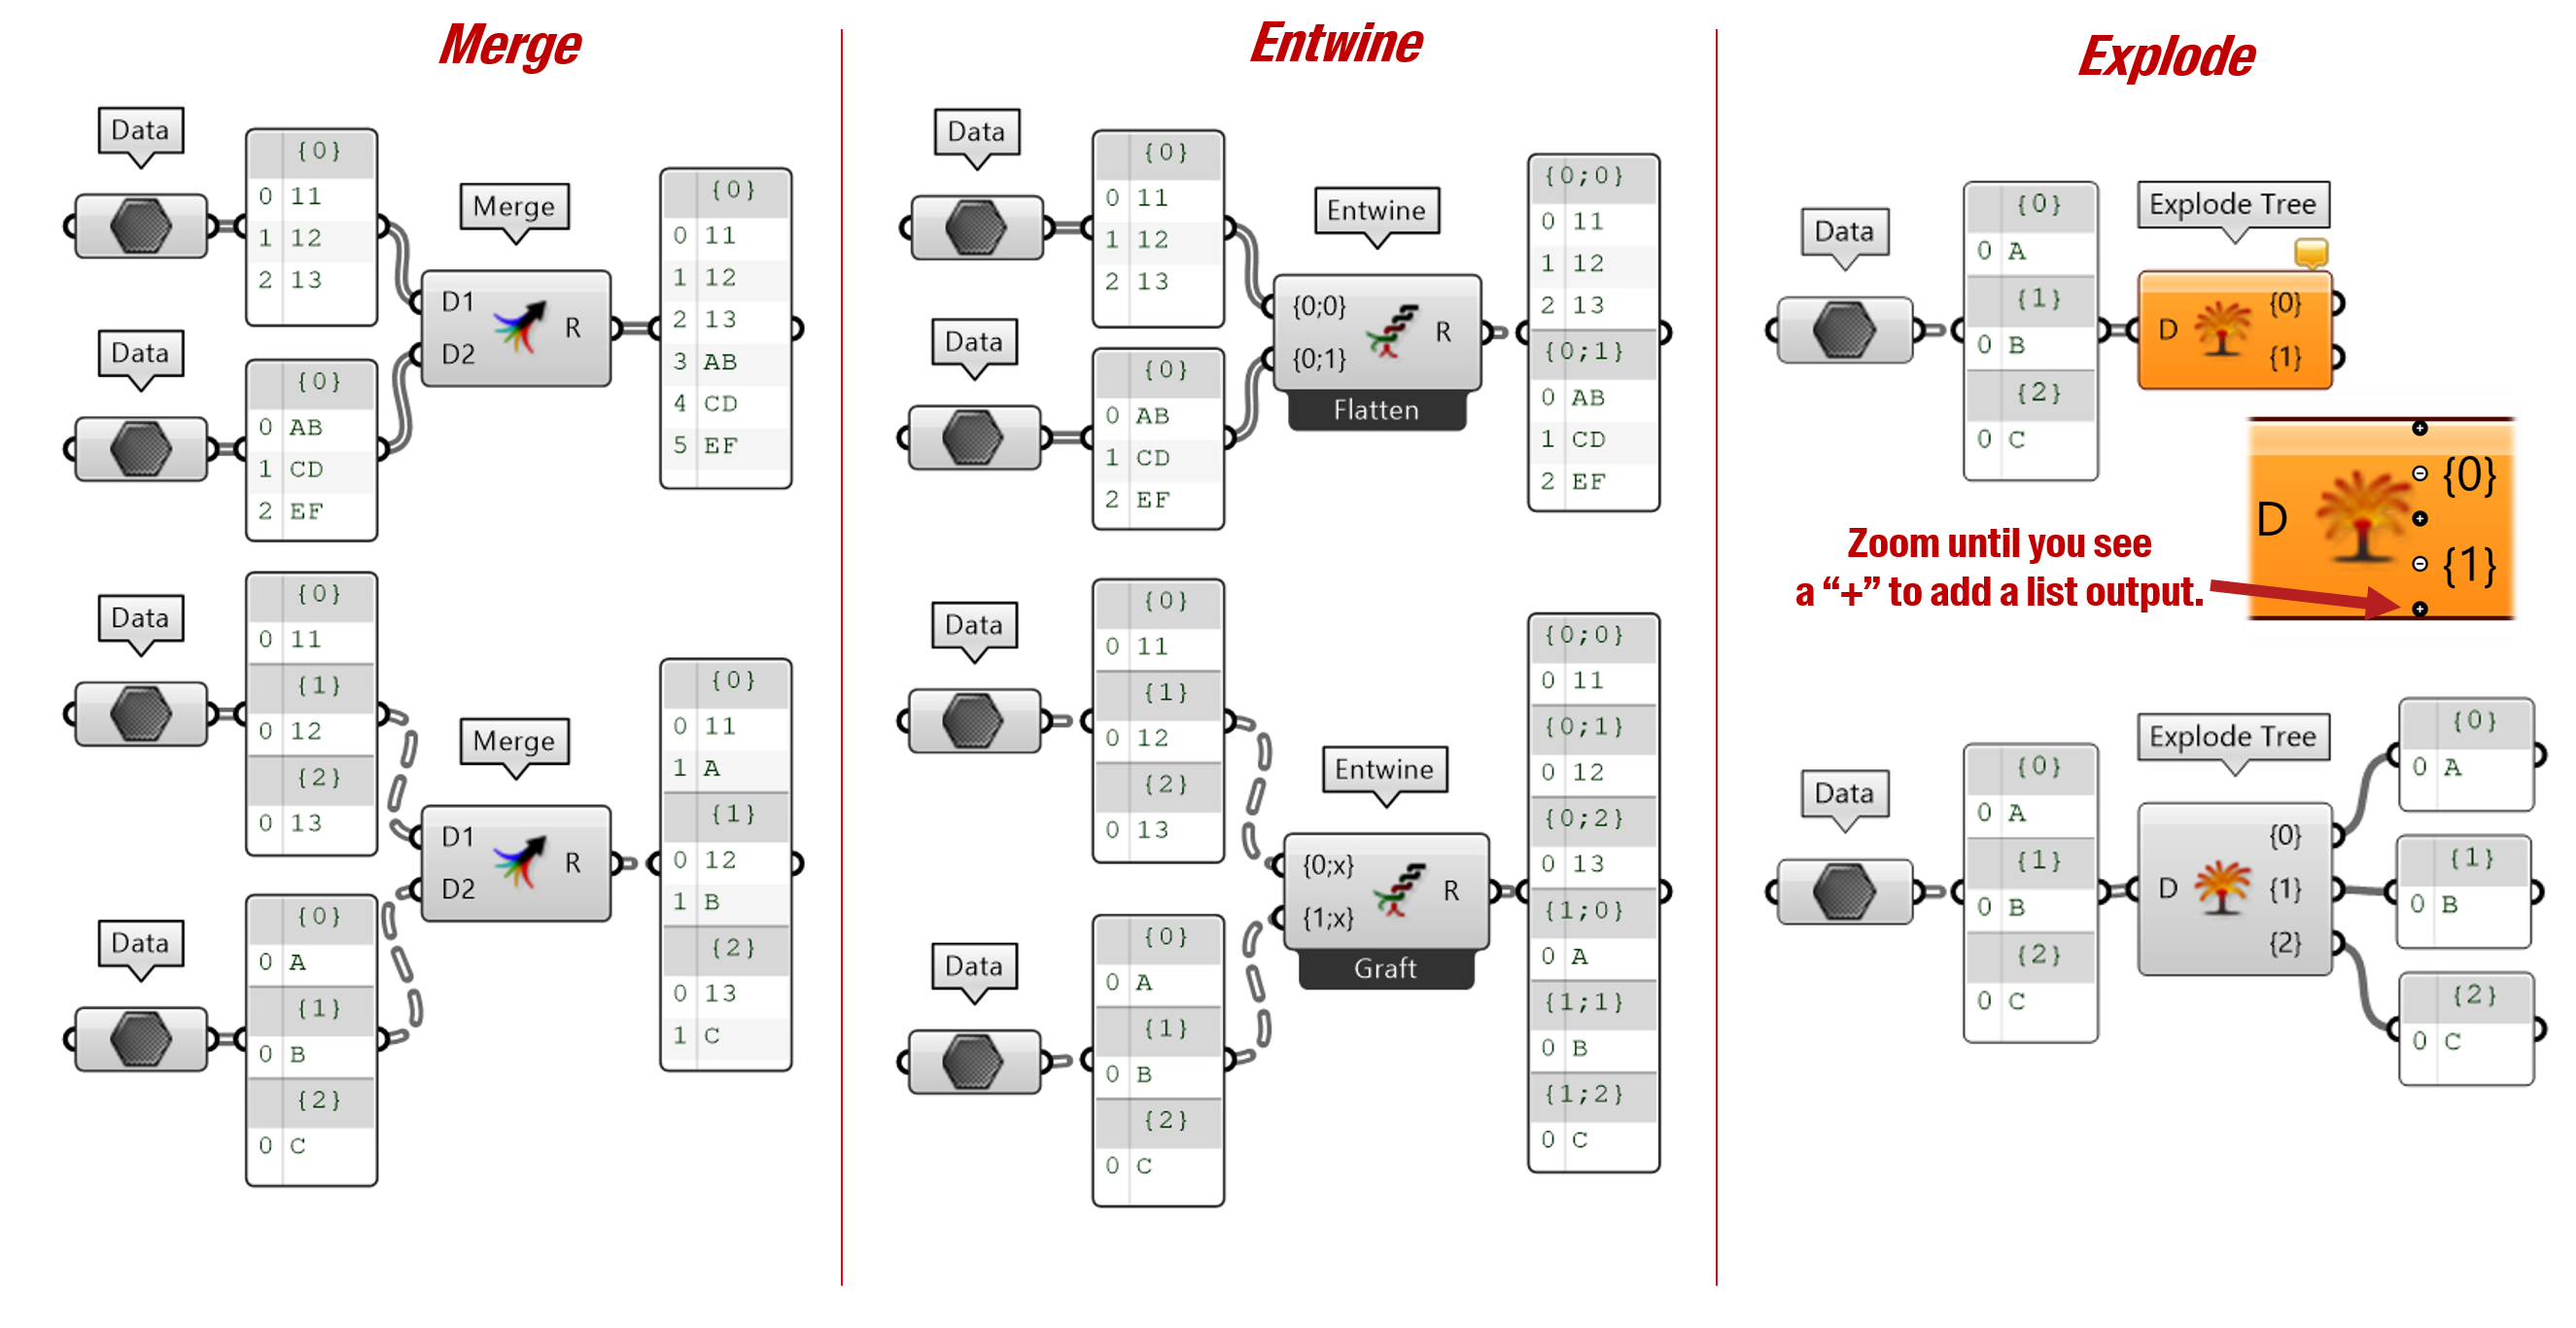
Other components allow to combine several data trees into one or on the contrary to separate a tree into several sub-trees. The “Merge” and “Entwine” components are both used to combine several data trees into one but their behavior is slightly different.
If you look closely at the example below, “Merge” will take the elements of two matching branches (which have the same path) and put those elements sequentially inside the same branch. On the other hand, “Entwine” will combine the two data trees but will keep their data separated by assigning new paths to each of their branch.
Lastly, the “Explode” component allows splitting a data tree according to its number of branches. Note, that you need to manually add the correct number of output (zoom on the component and click on the small “+”) to match the number of branches in the data tree.
Custom operations
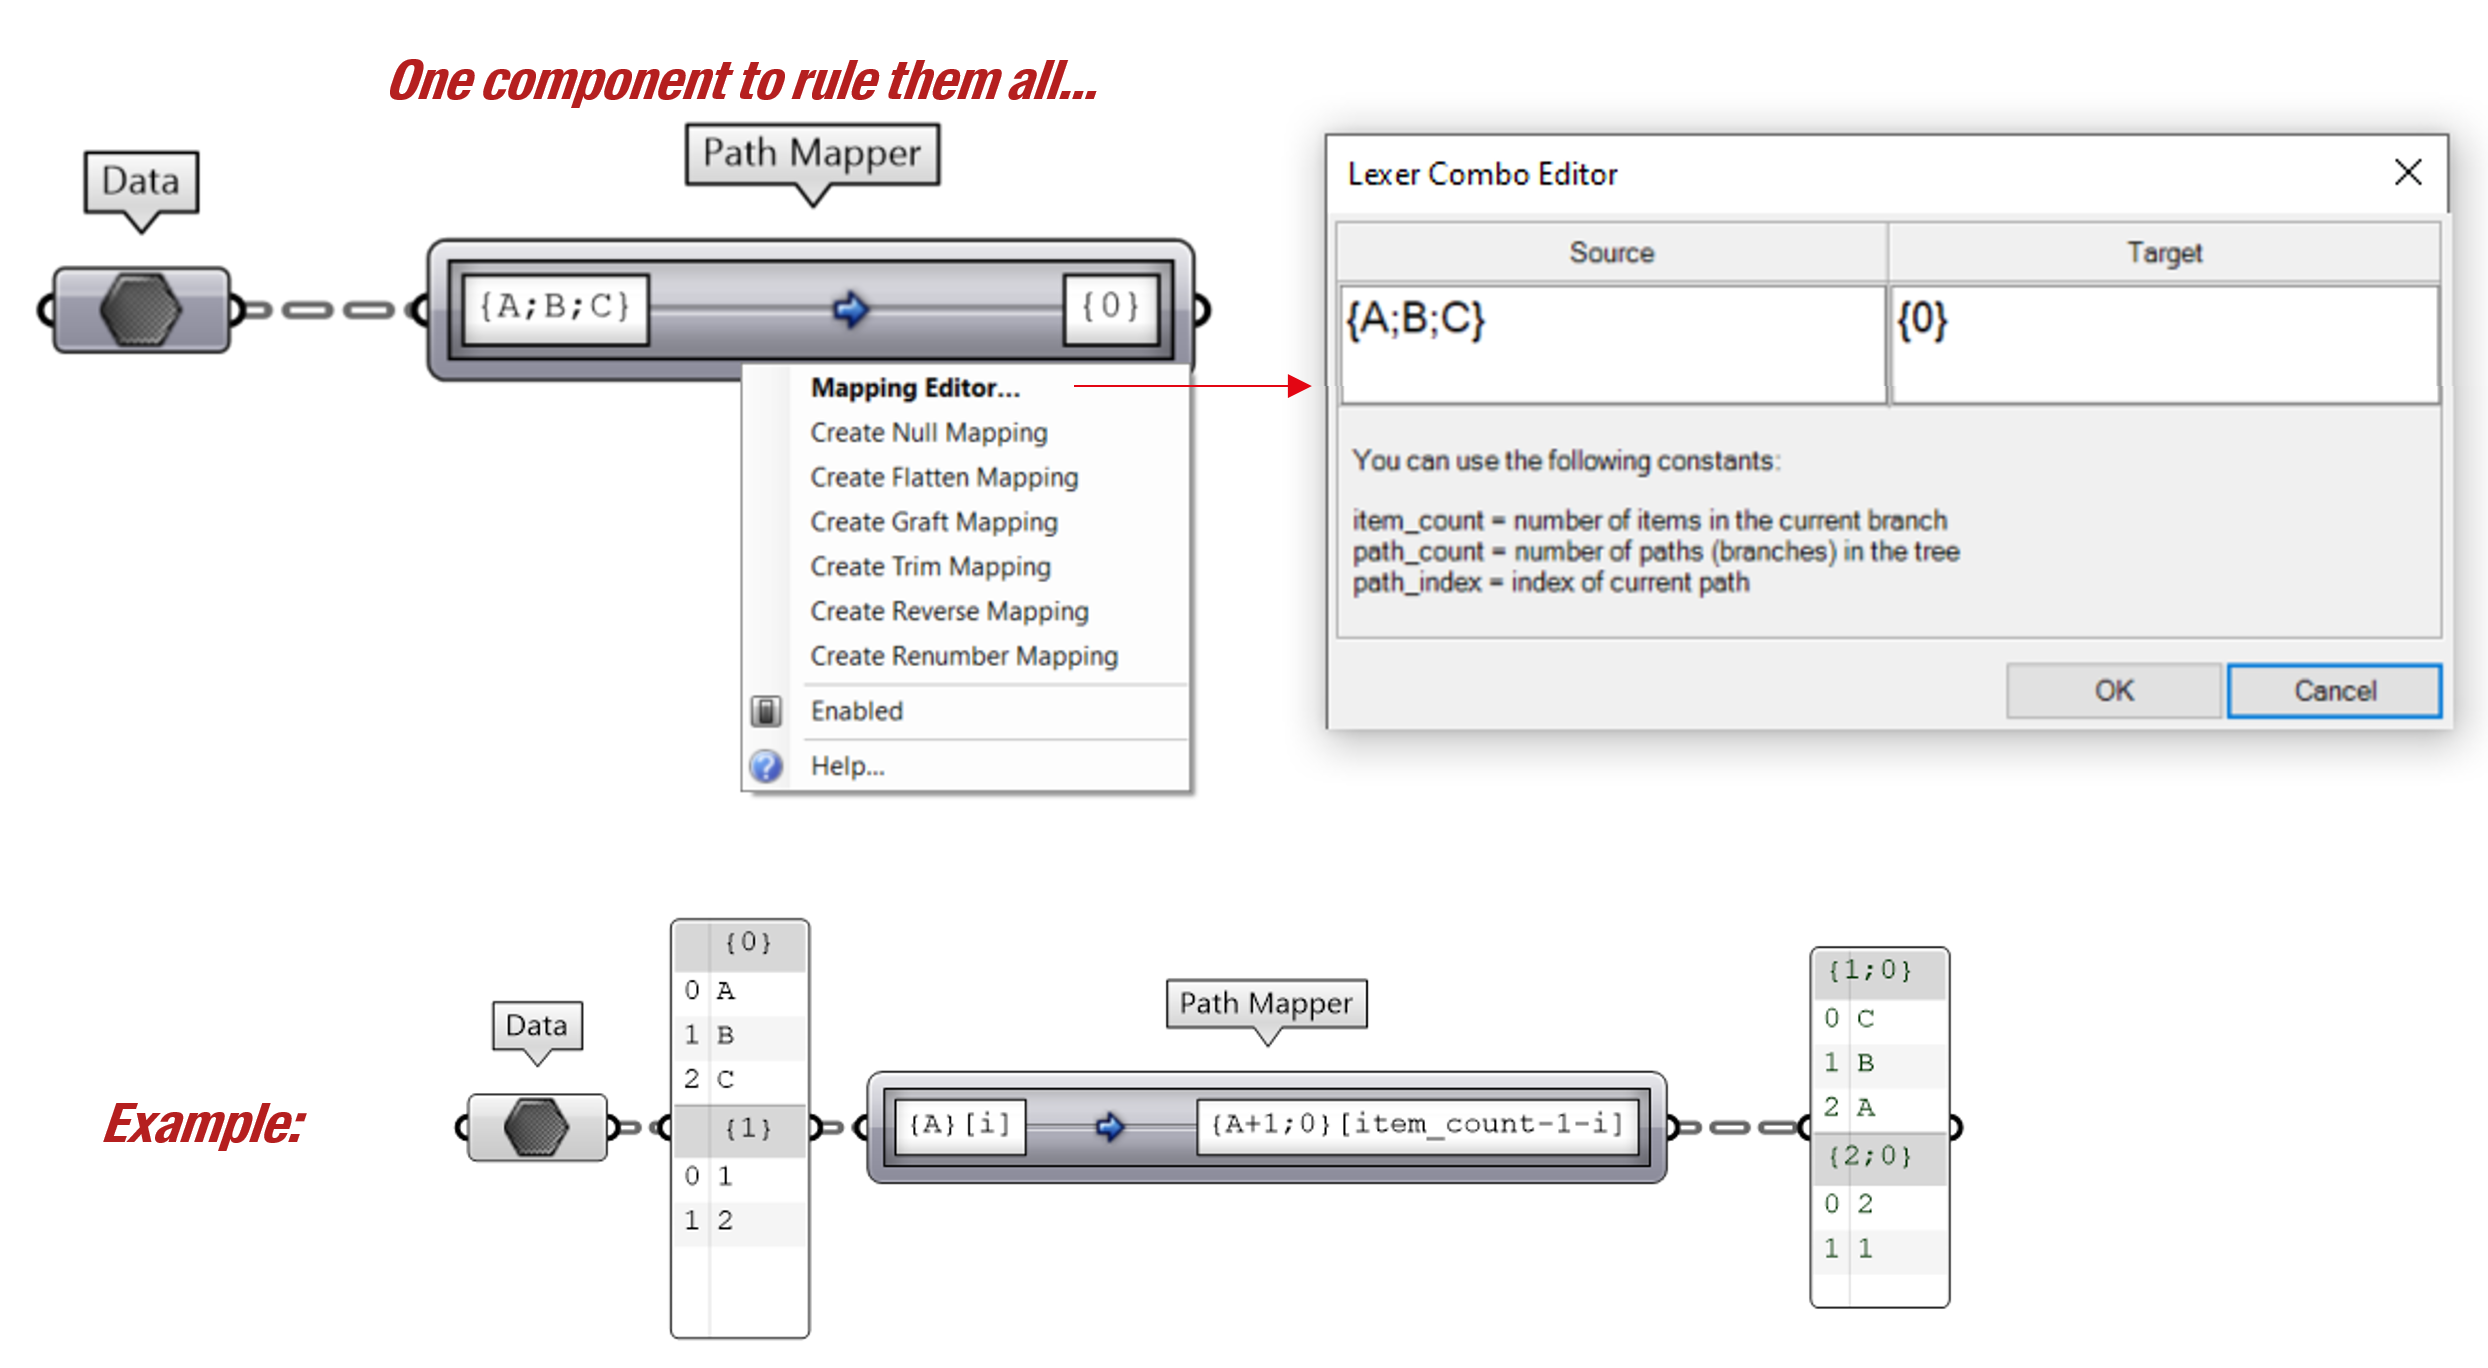
Grasshopper also provides a very powerful way of dealing with data trees with the “Path Mapper” component. It allows you to create a lexical rule to modify the structure of a data tree. With a right-click on the “Path Mapper”, you can open the “Mapping Editor” with which you can easily recreate the behavior of some of the components described above or create your own rules. For further information on the path mapper, we redirect you towards this article.
Some final thoughts on data trees
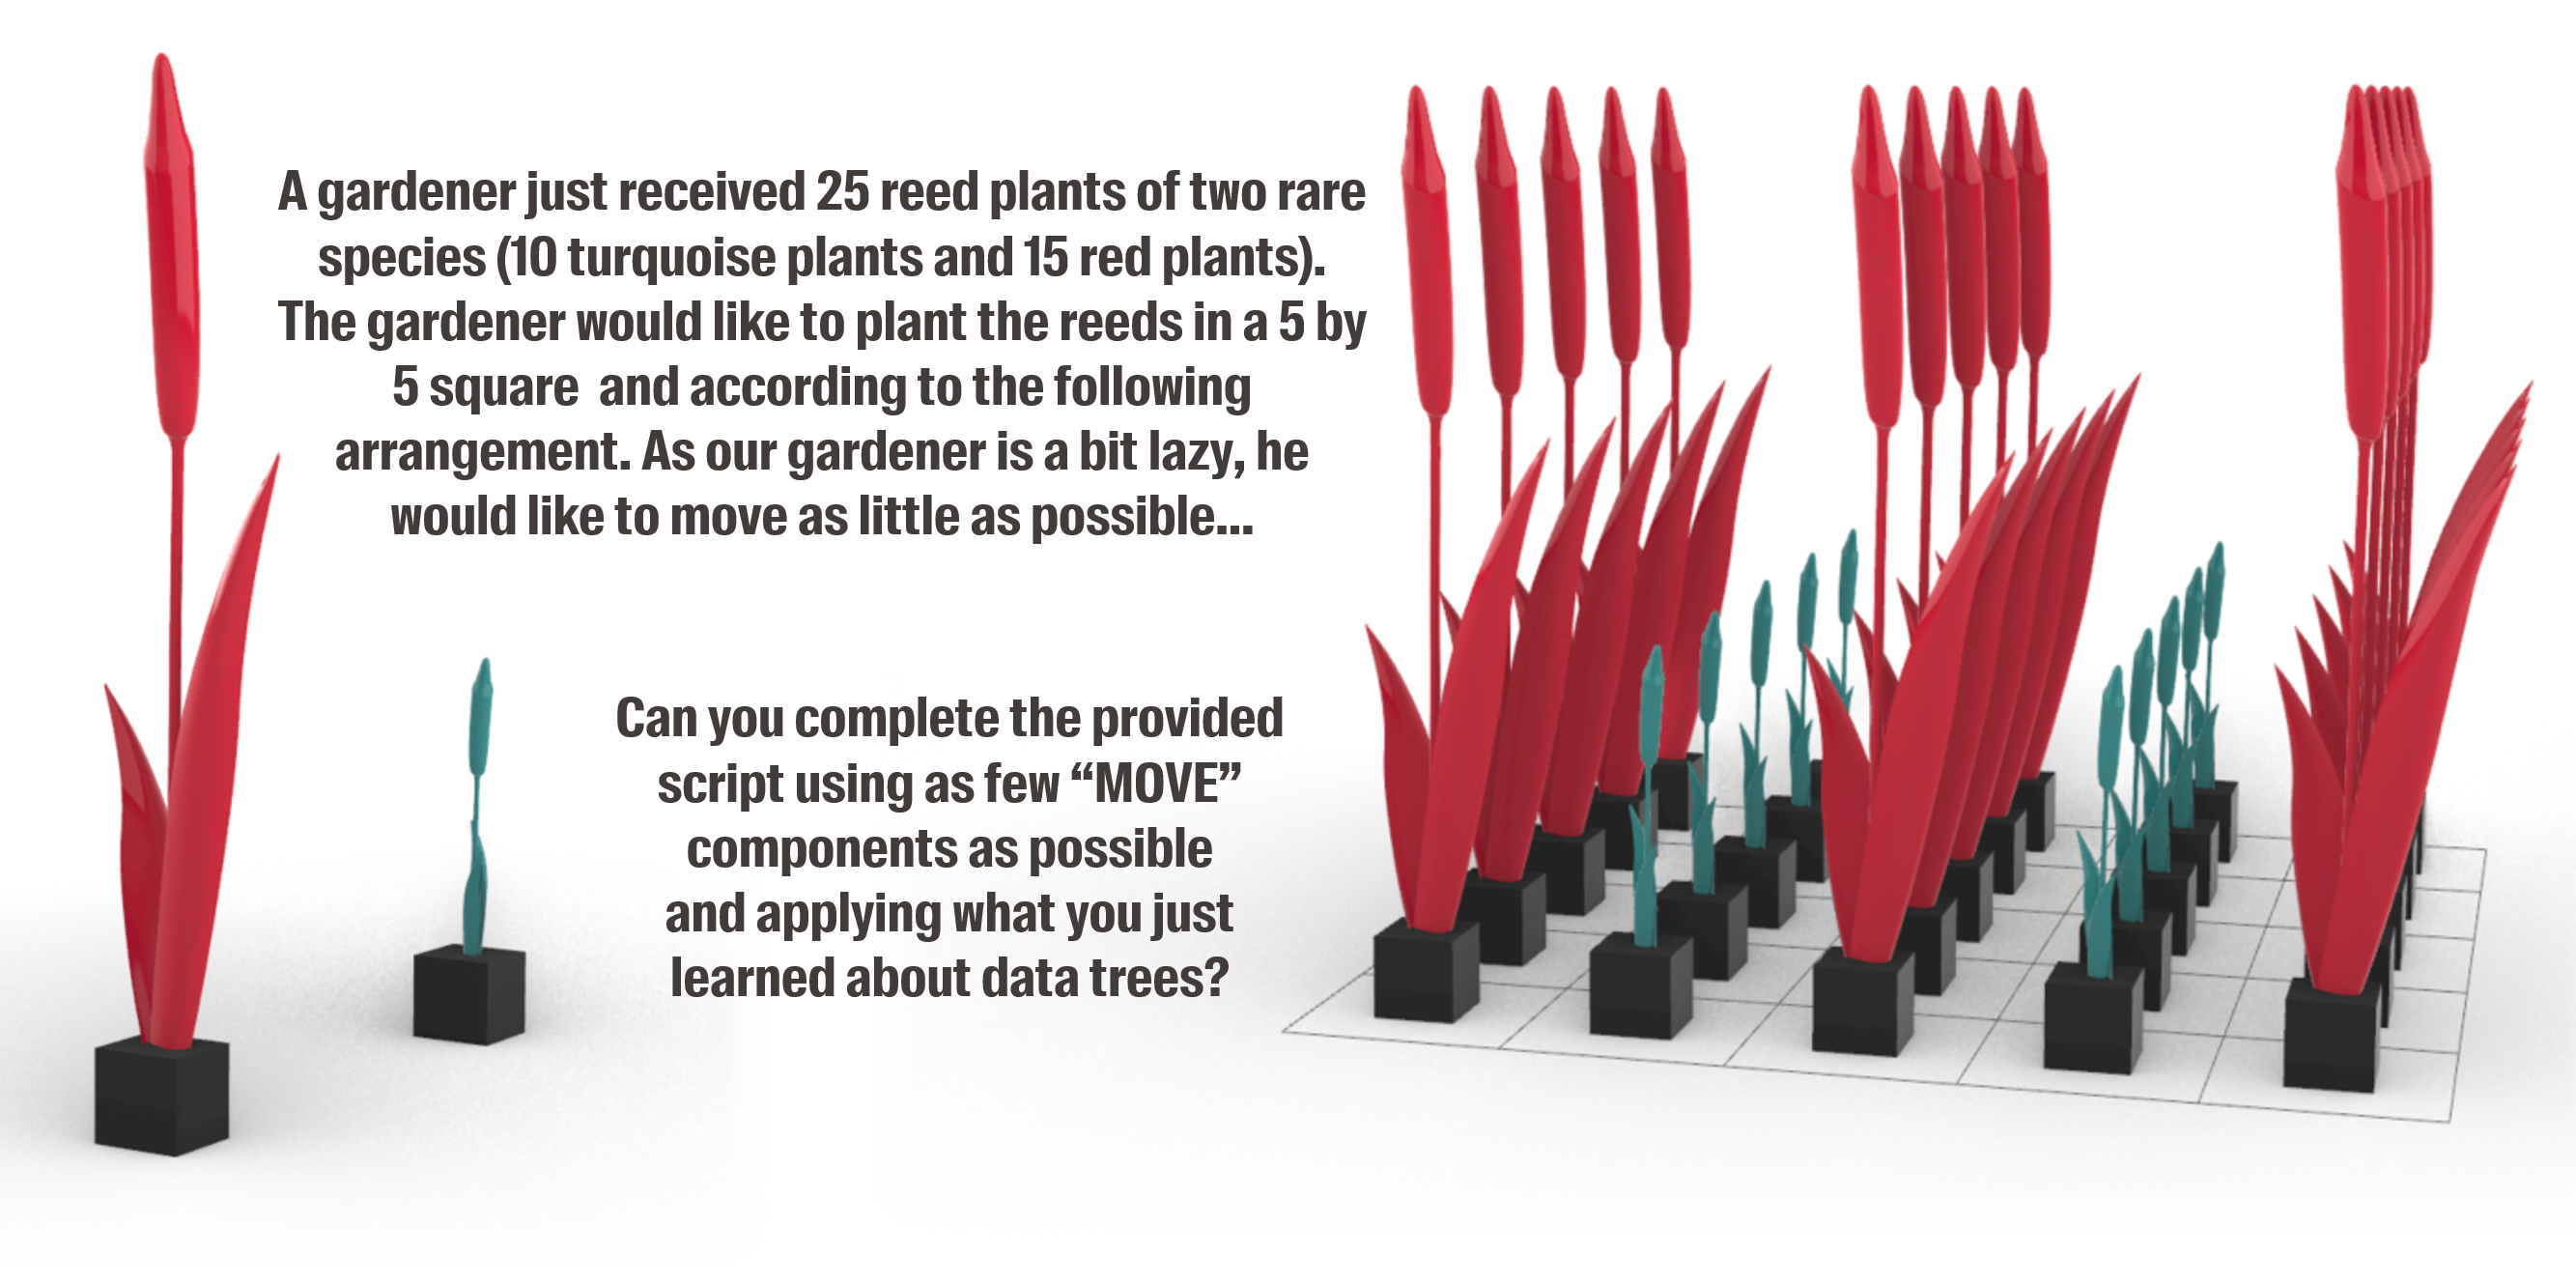
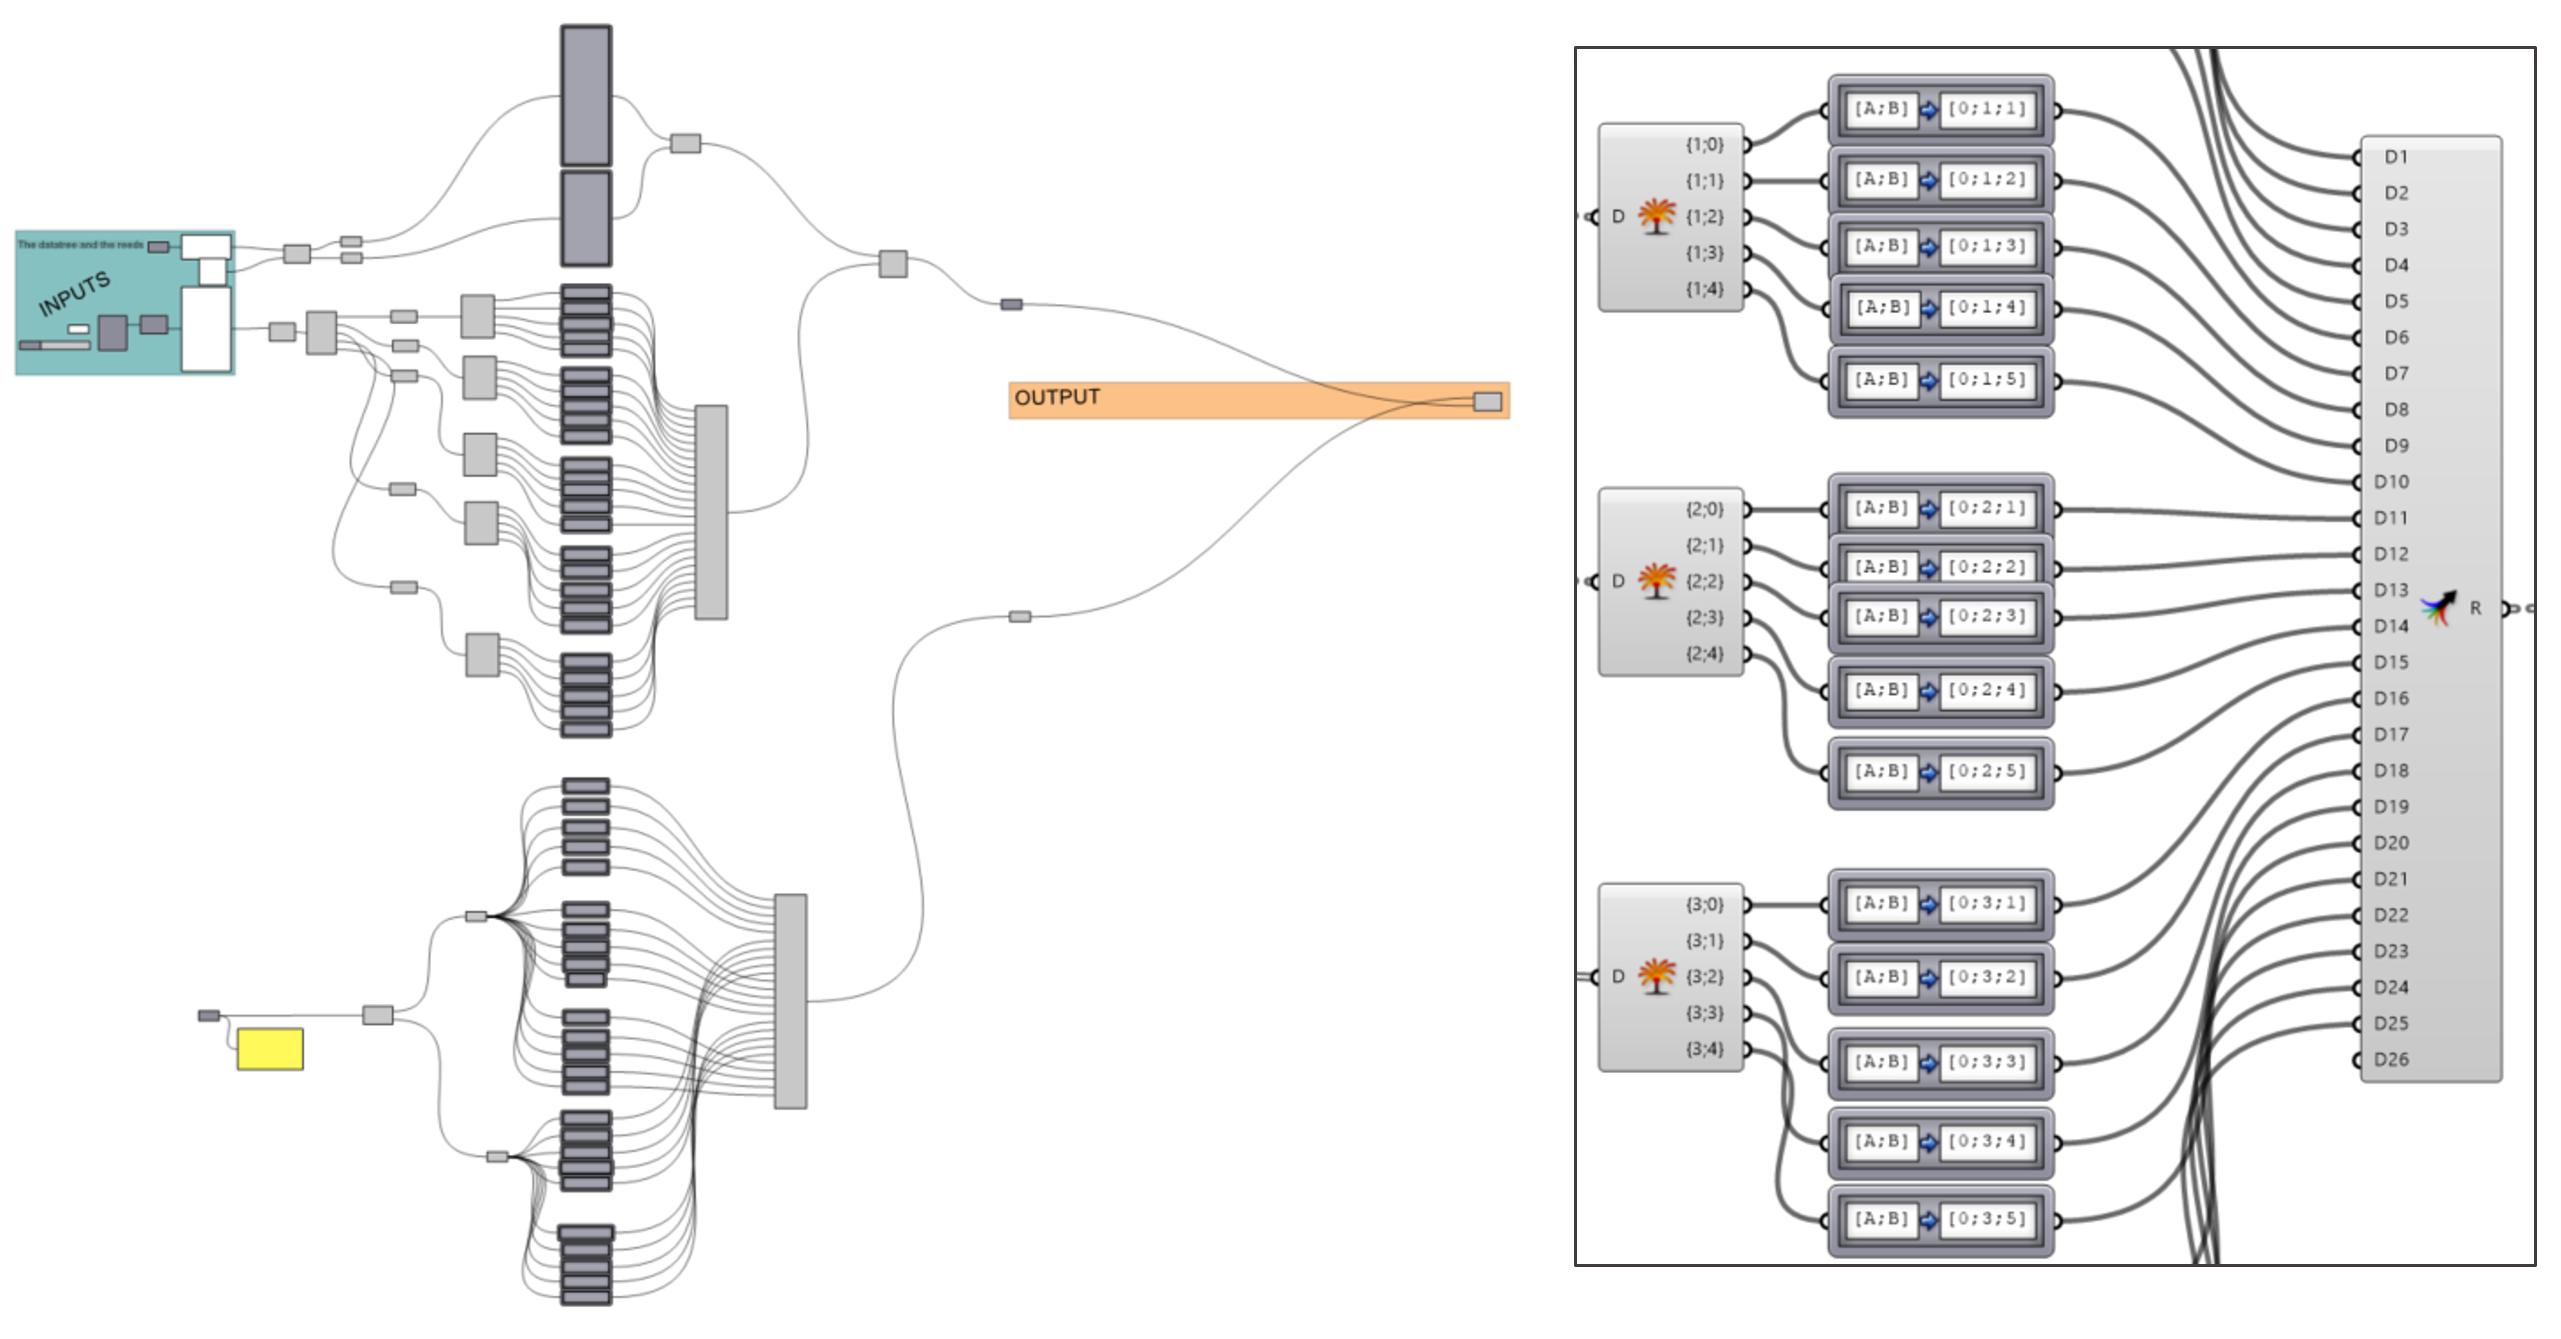
Manipulating data trees takes some time to master. At first, you might be tempted to overuse “Flatten” in order to only work with simple lists. To illustrate the power of data trees, here is a small exercise we gave to our students in 2022. The students were asked to create a code to copy and move two types of plants on a 5x5 grid using a minimum of components.
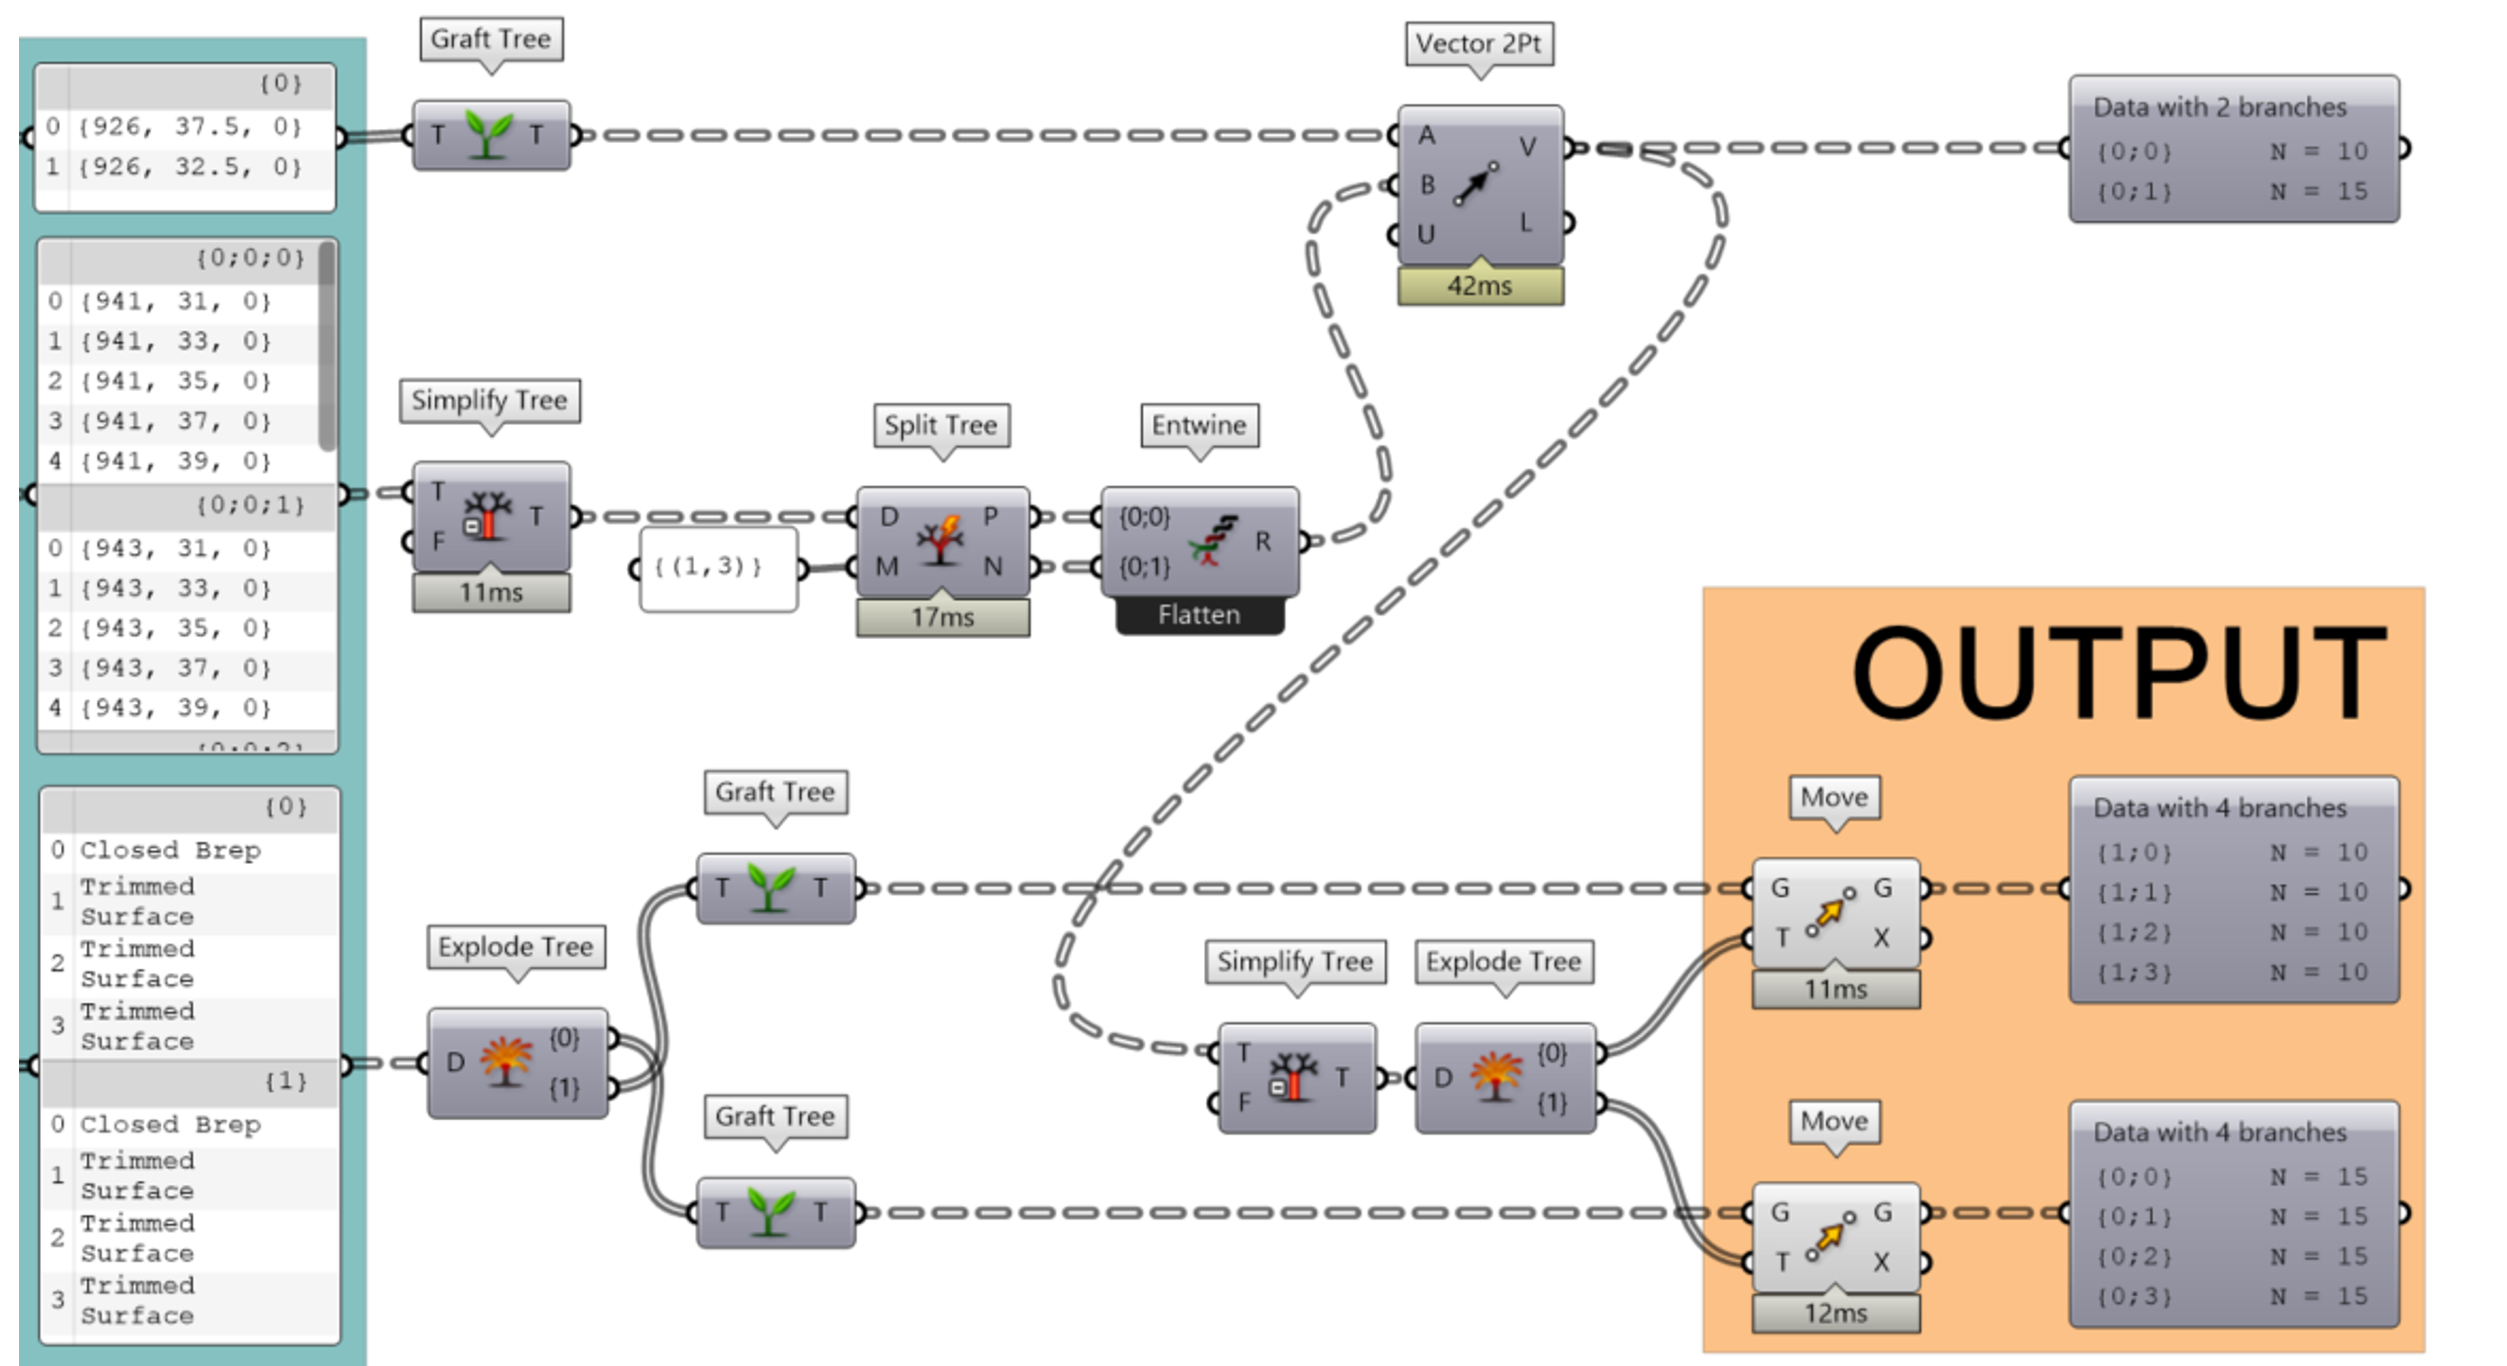
Here is a solution using some of the components mentioned above:
Now a solution where a student flattened the original data tree and had to manually deal with each element:
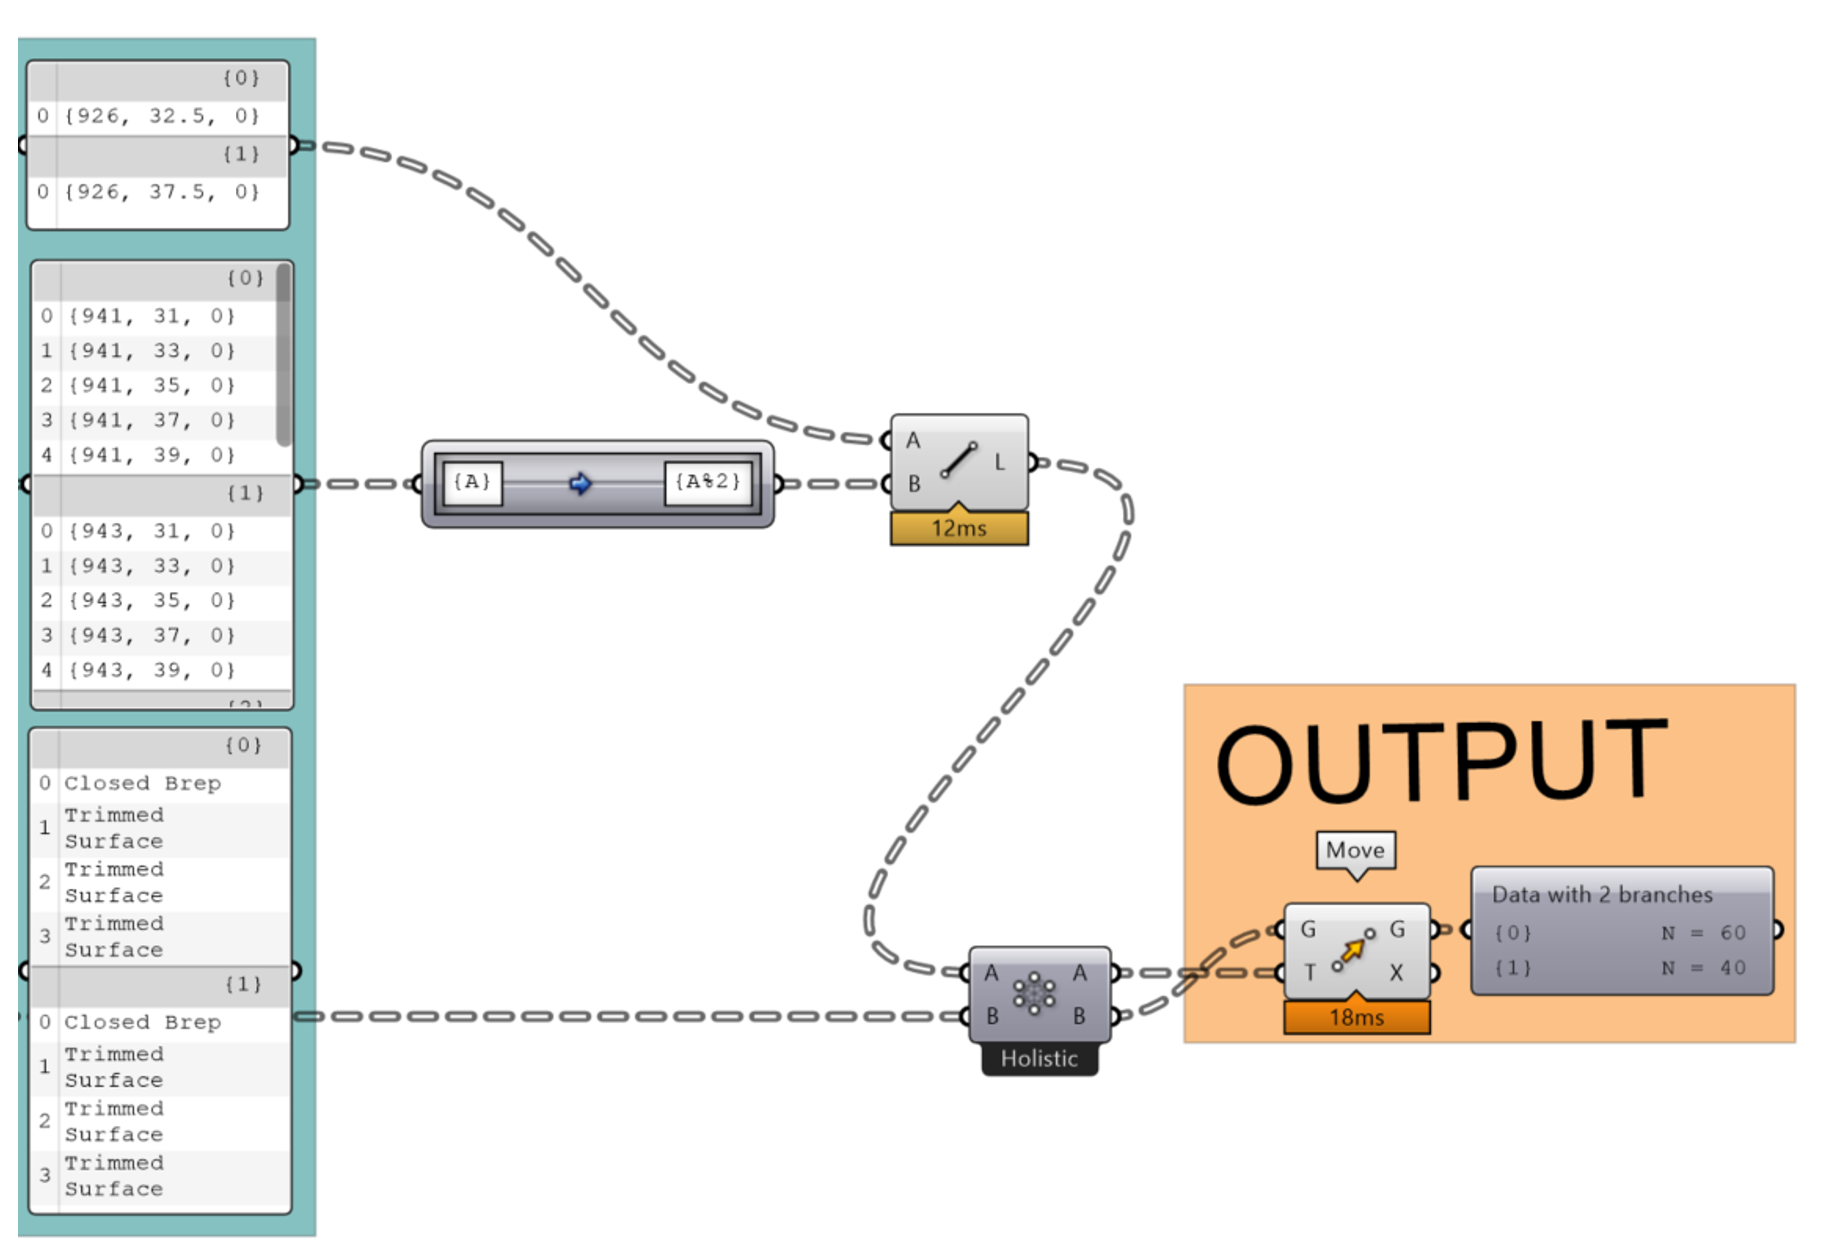
And finally, a very short and elegant solution found by another student who relied on the path mapper:
Ultimately, remember that if your code is working, you are already successful!